
MATLAB: An Introduction with Applications
6th Edition
ISBN: 9781119256830
Author: Amos Gilat
Publisher: John Wiley & Sons Inc
expand_more
expand_more
format_list_bulleted
Related questions
Question
thumb_up100%
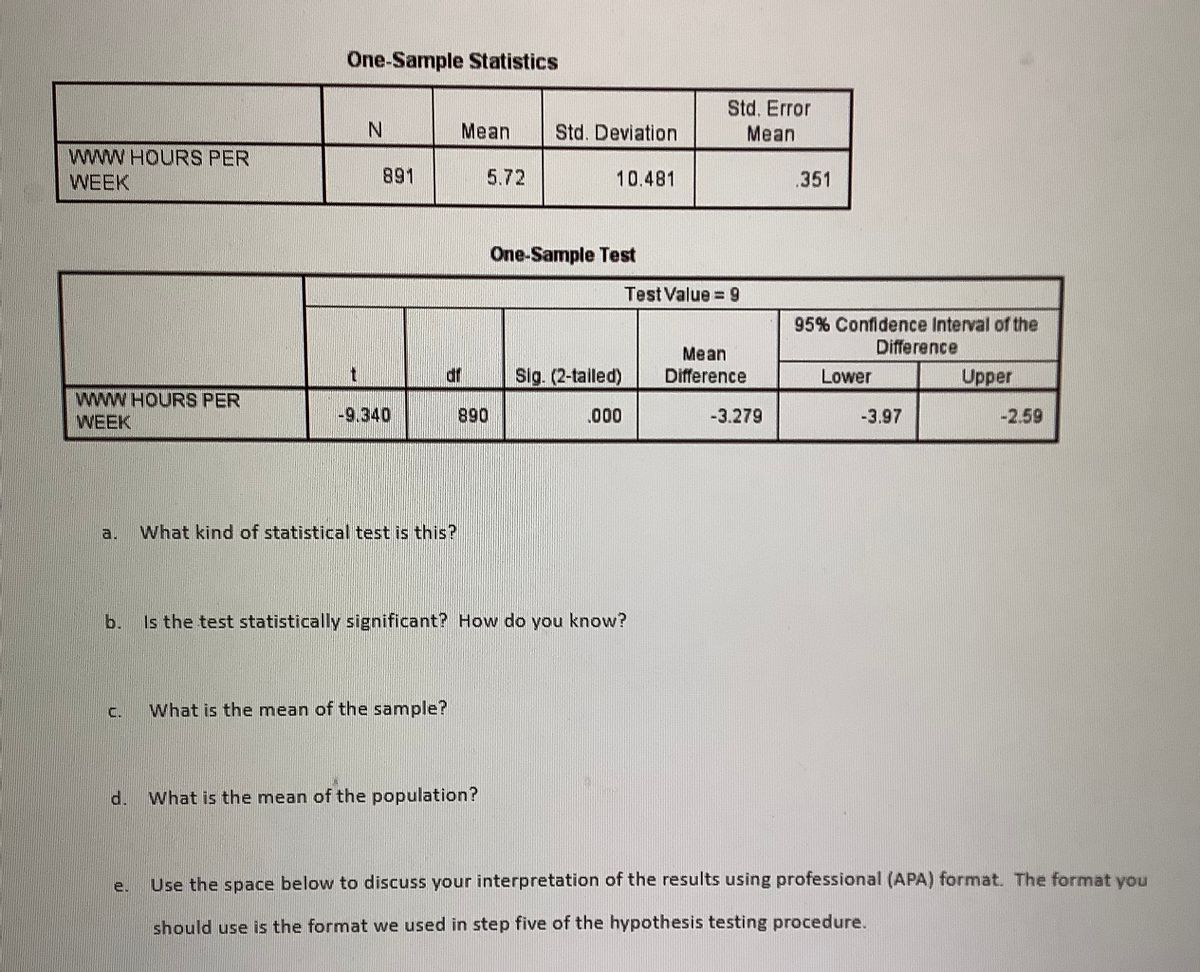

Transcribed Image Text:One-Sample Statistics
Std. Error
Mean
Mean
Std. Deviation
wwW HOURS PER
WEEK
891
5.72
10.481
.351
One-Sample Test
Test Value 9
95% Confidence Interval of the
Difference
Mean
Difference
df
Sig. (2-tailed)
Lower
Upper
wwW HOURS PER
WEEK
-9.340
890
.000
-3.279
-3.97
-2.59
a.
What kind of statistical test is this?
b.
Is the test statistically significant? How do you know?
C.
What is the mean of the sample?
What is the mean of the population?
e.
Use the space below to discuss your interpretation of the results using professional (APA) format. The format you
should use is the format we used in step five of the hypothesis testing procedure.
Expert Solution
This question has been solved!
Explore an expertly crafted, step-by-step solution for a thorough understanding of key concepts.

Step by stepSolved in 2 steps

Follow-up Questions
Read through expert solutions to related follow-up questions below.
Follow-up Question
Sub part~ d) what is the
e)interpretation in APA format

Transcribed Image Text:One-Sample Statistics
Std. Error
Mean
Mean
Std. Deviation
wwW HOURS PER
WEEK
891
5.72
10.481
.351
One-Sample Test
Test Value 9
95% Confidence Interval of the
Difference
Mean
Difference
df
Sig. (2-tailed)
Lower
Upper
wwW HOURS PER
WEEK
-9.340
890
.000
-3.279
-3.97
-2.59
a.
What kind of statistical test is this?
b.
Is the test statistically significant? How do you know?
C.
What is the mean of the sample?
What is the mean of the population?
e.
Use the space below to discuss your interpretation of the results using professional (APA) format. The format you
should use is the format we used in step five of the hypothesis testing procedure.
Solution
by Bartleby Expert
Follow-up Questions
Read through expert solutions to related follow-up questions below.
Follow-up Question
Sub part~ d) what is the
e)interpretation in APA format
Transcribed Image Text:One-Sample Statistics
Std. Error
Mean
Mean
Std. Deviation
wwW HOURS PER
WEEK
891
5.72
10.481
.351
One-Sample Test
Test Value 9
95% Confidence Interval of the
Difference
Mean
Difference
df
Sig. (2-tailed)
Lower
Upper
wwW HOURS PER
WEEK
-9.340
890
.000
-3.279
-3.97
-2.59
a.
What kind of statistical test is this?
b.
Is the test statistically significant? How do you know?
C.
What is the mean of the sample?
What is the mean of the population?
e.
Use the space below to discuss your interpretation of the results using professional (APA) format. The format you
should use is the format we used in step five of the hypothesis testing procedure.
Solution
by Bartleby Expert
Knowledge Booster

Similar questions
- If Ashley wants to test for GPA differences among first-, second-, third-, and fourth-year college students, which of these difference tests should she use? A. chi-square test of independence B. between-subjects, two-way ANOVA C. between-subjects, one-way ANOVA D. repeated-measures ANOVAarrow_forwardNumber of persons in the household 1 2 A. Below is a distribution of the variable "hompop" from the 2016 General Social Survey dataset. This variable is a measure of the number of people in each respondent's household. Use the table to answer the following questions. 3 4 5 7 8 9 10 11 Total www Freq. 850 1,069 436 278 139 58 19 2,867 percent 29.65 37.29 15.21 9.70 4.85 2.02 0.66 0.31 0.24 0.03 0.03 100.00 Cum. 29.65 66.93 82.14 91.84 96.69 98.71 99.37 99.69 99.93 99.97 100.00 1arrow_forwardPlease answer the question in the picture below to answer the question in the other picturearrow_forward
arrow_back_ios
arrow_forward_ios
Recommended textbooks for you
- MATLAB: An Introduction with ApplicationsStatisticsISBN:9781119256830Author:Amos GilatPublisher:John Wiley & Sons Inc
 Probability and Statistics for Engineering and th...StatisticsISBN:9781305251809Author:Jay L. DevorePublisher:Cengage Learning
 Statistics for The Behavioral Sciences (MindTap C...StatisticsISBN:9781305504912Author:Frederick J Gravetter, Larry B. WallnauPublisher:Cengage Learning
  Elementary Statistics: Picturing the World (7th E...StatisticsISBN:9780134683416Author:Ron Larson, Betsy FarberPublisher:PEARSON
 The Basic Practice of StatisticsStatisticsISBN:9781319042578Author:David S. Moore, William I. Notz, Michael A. FlignerPublisher:W. H. Freeman
 Introduction to the Practice of StatisticsStatisticsISBN:9781319013387Author:David S. Moore, George P. McCabe, Bruce A. CraigPublisher:W. H. Freeman
MATLAB: An Introduction with Applications
Statistics
ISBN:9781119256830
Author:Amos Gilat
Publisher:John Wiley & Sons Inc
Probability and Statistics for Engineering and th...
Statistics
ISBN:9781305251809
Author:Jay L. Devore
Publisher:Cengage Learning
Statistics for The Behavioral Sciences (MindTap C...
Statistics
ISBN:9781305504912
Author:Frederick J Gravetter, Larry B. Wallnau
Publisher:Cengage Learning
Elementary Statistics: Picturing the World (7th E...
Statistics
ISBN:9780134683416
Author:Ron Larson, Betsy Farber
Publisher:PEARSON
The Basic Practice of Statistics
Statistics
ISBN:9781319042578
Author:David S. Moore, William I. Notz, Michael A. Fligner
Publisher:W. H. Freeman
Introduction to the Practice of Statistics
Statistics
ISBN:9781319013387
Author:David S. Moore, George P. McCabe, Bruce A. Craig
Publisher:W. H. Freeman