
MATLAB: An Introduction with Applications
6th Edition
ISBN: 9781119256830
Author: Amos Gilat
Publisher: John Wiley & Sons Inc
expand_more
expand_more
format_list_bulleted
Related questions
Concept explainers
Topic Video
Question
Can you assist me in answering this?
(this is not graded but, rather, an excersice conducive to acquisition).
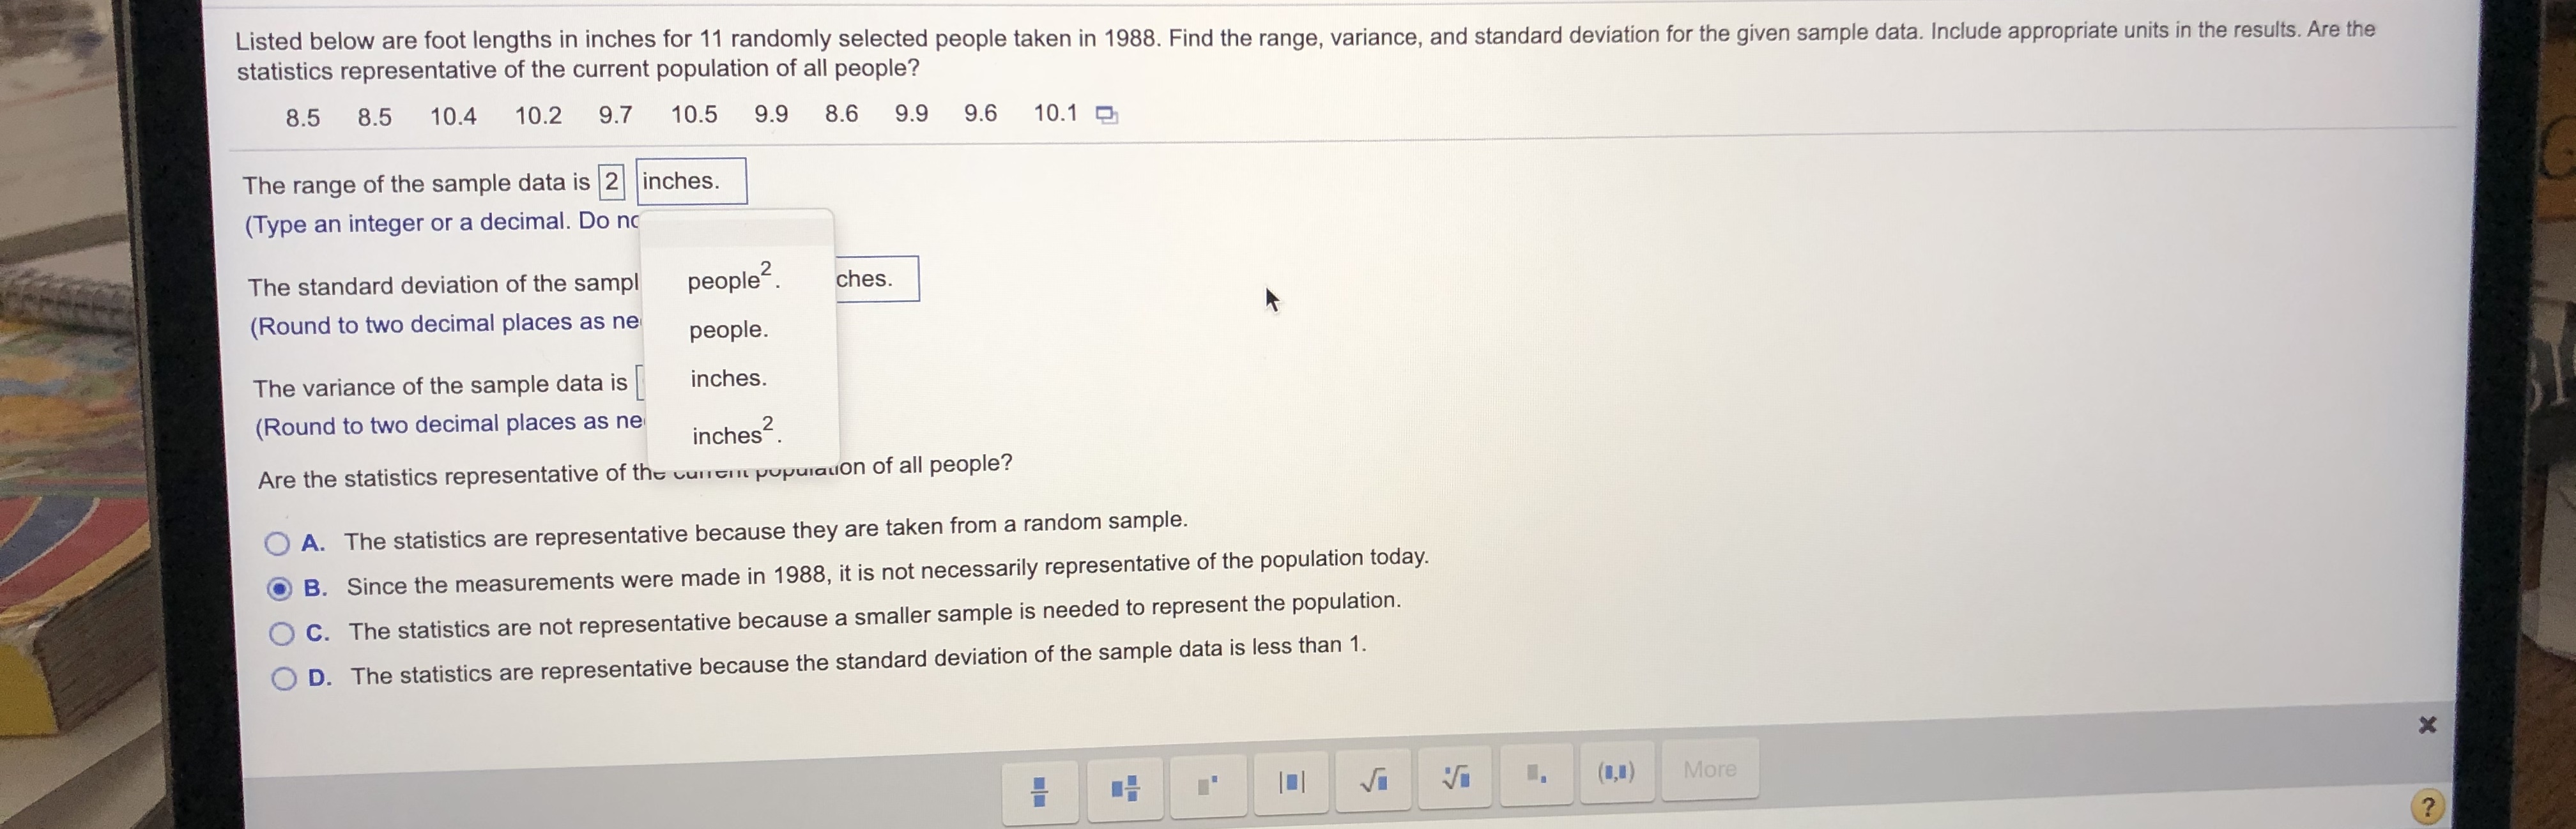

Transcribed Image Text:Listed below are foot lengths in inches for 11 randomly selected people taken in 1988. Find the range, variance, and standard deviation for the given sample data. Include appropriate units in the results. Are the
statistics representative of the current population of all people?
8.5
8.5
10.4
10.2
9.7
10.5
9.9
8.6
9.9
9.6
10.1 O
The range of the sample data is 2 inches.
(Type an integer or a decimal. Do no
The standard deviation of the sampl
people?.
ches.
(Round to two decimal places as ne
people.
inches.
The variance of the sample data is
(Round to two decimal places as ne
inches?.
Are the statistics representative of the urtni pupulauon of all people?
A. The statistics are representative because they are taken from a random sample.
B. Since the measurements were made in 1988, it is not necessarily representative of the population today.
C. The statistics are not representative because a smaller sample is needed to represent the population.
D. The statistics are representative because the standard deviation of the sample data is less than 1.
(1,1)
More
Expert Solution
This question has been solved!
Explore an expertly crafted, step-by-step solution for a thorough understanding of key concepts.

This is a popular solution

Trending nowThis is a popular solution!

Step by stepSolved in 4 steps with 6 images

Knowledge Booster


Learn more about
Need a deep-dive on the concept behind this application? Look no further. Learn more about this topic, statistics and related others by exploring similar questions and additional content below.Similar questions
- 1. Þ(8) Answer: Show your work or explain your reasoning here:arrow_forwardI'm confused with question 14 because I cant find an example to follow. Could you help, please? Thank you.arrow_forwardMy question to this non seeable answer is what is the answer? You cant see the answer because the answer was cut off from the screen. Can you help, please.arrow_forward
- please help me with this. everything is includedarrow_forward(2) (2) (2) (2) བྱེ བྱ བྱེ བྱེ བྱེ 1.1 1.2 Reamorata is a student at Nelson Mandela Metropolitan University (NMMU) Vista Campus in Port Elizabeth. ANNEXURE A shows a map/plan of the layout of the campus where he attends classes. Use ANNEXURE A to answer the questions that follow. 1.1.1 Identify the type of map/plan used and write it down. 1.1.2 Give one purpose of the building marked as number 15. 1.1.3 Name the province where Port Elizabeth is situated. 1.1.4 What symbol is used to show parking on the campus? 1.1.5 How many lecture halls are shown on the map/plan. In picture 1 and picture 2 two clocks are shown. 10 PICTURE 1 12 112 2 PICTURE 2 9 00 8 4. 765 5:44 LITE Use the information above to answer the questions that follow. 1.2.1 Name the two time formats used to display the time on the clocks. 1.2.2 Write down, in words, the time displayed on the clock in picture 2. 1.2.3 Convert 13 hours 57 minutes to hours. (2) (2) (2)arrow_forward
arrow_back_ios
arrow_forward_ios
Recommended textbooks for you
- MATLAB: An Introduction with ApplicationsStatisticsISBN:9781119256830Author:Amos GilatPublisher:John Wiley & Sons Inc
 Probability and Statistics for Engineering and th...StatisticsISBN:9781305251809Author:Jay L. DevorePublisher:Cengage Learning
 Statistics for The Behavioral Sciences (MindTap C...StatisticsISBN:9781305504912Author:Frederick J Gravetter, Larry B. WallnauPublisher:Cengage Learning
  Elementary Statistics: Picturing the World (7th E...StatisticsISBN:9780134683416Author:Ron Larson, Betsy FarberPublisher:PEARSON
 The Basic Practice of StatisticsStatisticsISBN:9781319042578Author:David S. Moore, William I. Notz, Michael A. FlignerPublisher:W. H. Freeman
 Introduction to the Practice of StatisticsStatisticsISBN:9781319013387Author:David S. Moore, George P. McCabe, Bruce A. CraigPublisher:W. H. Freeman
MATLAB: An Introduction with Applications
Statistics
ISBN:9781119256830
Author:Amos Gilat
Publisher:John Wiley & Sons Inc
Probability and Statistics for Engineering and th...
Statistics
ISBN:9781305251809
Author:Jay L. Devore
Publisher:Cengage Learning
Statistics for The Behavioral Sciences (MindTap C...
Statistics
ISBN:9781305504912
Author:Frederick J Gravetter, Larry B. Wallnau
Publisher:Cengage Learning
Elementary Statistics: Picturing the World (7th E...
Statistics
ISBN:9780134683416
Author:Ron Larson, Betsy Farber
Publisher:PEARSON
The Basic Practice of Statistics
Statistics
ISBN:9781319042578
Author:David S. Moore, William I. Notz, Michael A. Fligner
Publisher:W. H. Freeman
Introduction to the Practice of Statistics
Statistics
ISBN:9781319013387
Author:David S. Moore, George P. McCabe, Bruce A. Craig
Publisher:W. H. Freeman