
MATLAB: An Introduction with Applications
6th Edition
ISBN: 9781119256830
Author: Amos Gilat
Publisher: John Wiley & Sons Inc
expand_more
expand_more
format_list_bulleted
Related questions
Question
What is the meaning of X axis and Y axis? How to interpretate the data?
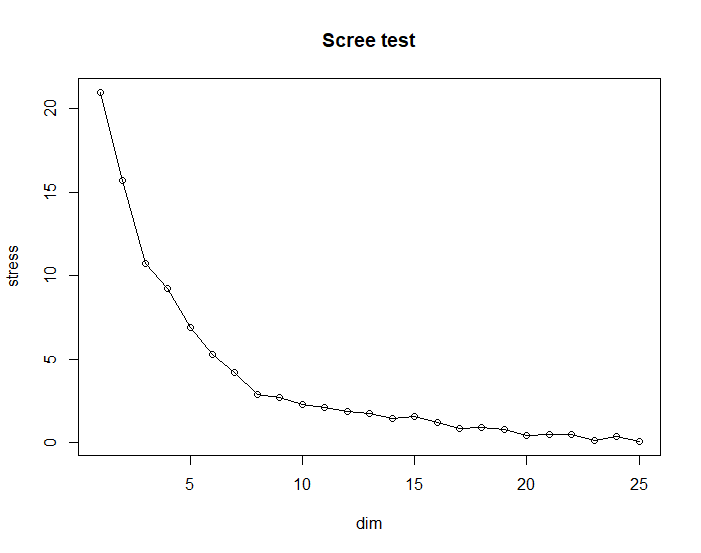

Transcribed Image Text:Scree test
20
10
15
25
dim
stress
15
20
Expert Solution
This question has been solved!
Explore an expertly crafted, step-by-step solution for a thorough understanding of key concepts.

Step by stepSolved in 2 steps

Knowledge Booster

Similar questions
- According to your textbook, the dependent variable is also called the measure. criterion. principle. standard. predictor.arrow_forwardlecture(11.12): A large amount of scatter in a scatter plot is an indication that the relationship between the two variables is (a) negative (b) strong (c) weak (d) moderate (e) positivearrow_forwardNeed asap. Just need help with the last answer.arrow_forward
- Please answer quickly! Show work!arrow_forwardYou wonder whether talking to plants keeps them from dying. You conduct a study in which you talk to one group of five plants and do not talk to a second group of five plants. After two weeks, you record whether each plant has lived or died. This assessment of plant health is a(n) _____ dependent variable, which means that the data can be analyzed using a(n) _____ test. a. nominal; parametric b. interval; parametric c. interval; nonparametric d. nominal; nonparametricarrow_forwardNeed help with the last answer in the red box as it is wrong.arrow_forward
- Please complete the rest of these questions thank you! The given scatter plot shows age versus test score data for a testof video game skills: d) Use your equation to predict the test score for a60 year-old test-taker.e) Estimate the value of the linear correlationcoefficient for your line. Explain your reasoning.arrow_forwardHelp me pleasearrow_forwardH. Use the model to predict sales when the business spends $885 ($'000) in the advertisement. Does the model underestimate or overestimate sales? G. What is the value of the coefficient of determination, R2? What does R2 tell us about explained variation in y? (Refer to Coefficient of Determination LO 12-4). H. Use the model to predict sales when the business spends $885 ($'000) in the advertisement. Does the model underestimate or overestimate sales?arrow_forward
- Make a scatter plot of the data and determine which type of model best fits the data. (-3,-1), (-2,0), (-1,1), (0,2), (1,3), (2,4)arrow_forwardWho do you think would be more fearful of walking in their neighborhoods at night: males or females? Must use gamma, Yule’s Q and 2 x 2 tables, what does the following table, and accompanying statistics, tell you about the actual direction and strength of the relationship? Support your Answer must be supported with details from the table.arrow_forwardI can do the scatter plot diagram I just need help With identifying the Y axis and the X access and the Form directions strength And outlierarrow_forward
arrow_back_ios
SEE MORE QUESTIONS
arrow_forward_ios
Recommended textbooks for you
- MATLAB: An Introduction with ApplicationsStatisticsISBN:9781119256830Author:Amos GilatPublisher:John Wiley & Sons Inc
 Probability and Statistics for Engineering and th...StatisticsISBN:9781305251809Author:Jay L. DevorePublisher:Cengage Learning
 Statistics for The Behavioral Sciences (MindTap C...StatisticsISBN:9781305504912Author:Frederick J Gravetter, Larry B. WallnauPublisher:Cengage Learning
  Elementary Statistics: Picturing the World (7th E...StatisticsISBN:9780134683416Author:Ron Larson, Betsy FarberPublisher:PEARSON
 The Basic Practice of StatisticsStatisticsISBN:9781319042578Author:David S. Moore, William I. Notz, Michael A. FlignerPublisher:W. H. Freeman
 Introduction to the Practice of StatisticsStatisticsISBN:9781319013387Author:David S. Moore, George P. McCabe, Bruce A. CraigPublisher:W. H. Freeman
MATLAB: An Introduction with Applications
Statistics
ISBN:9781119256830
Author:Amos Gilat
Publisher:John Wiley & Sons Inc
Probability and Statistics for Engineering and th...
Statistics
ISBN:9781305251809
Author:Jay L. Devore
Publisher:Cengage Learning
Statistics for The Behavioral Sciences (MindTap C...
Statistics
ISBN:9781305504912
Author:Frederick J Gravetter, Larry B. Wallnau
Publisher:Cengage Learning
Elementary Statistics: Picturing the World (7th E...
Statistics
ISBN:9780134683416
Author:Ron Larson, Betsy Farber
Publisher:PEARSON
The Basic Practice of Statistics
Statistics
ISBN:9781319042578
Author:David S. Moore, William I. Notz, Michael A. Fligner
Publisher:W. H. Freeman
Introduction to the Practice of Statistics
Statistics
ISBN:9781319013387
Author:David S. Moore, George P. McCabe, Bruce A. Craig
Publisher:W. H. Freeman