
Essentials Of Investments
11th Edition
ISBN: 9781260013924
Author: Bodie, Zvi, Kane, Alex, MARCUS, Alan J.
Publisher: Mcgraw-hill Education,
expand_more
expand_more
format_list_bulleted
Related questions
Question
What is the expected return of an equally weighted portfolio comprised of the following three stocks?
| State of Economy |
Probability of State of Economy |
Rate of Return if State Occurs |
||||||||
| Stock A | Stock B | Stock C | ||||||||
| Boom | .25 | .19 | .13 | .07 | ||||||
| Normal | .72 | .15 | .05 | .13 | ||||||
| Bust | .03 |
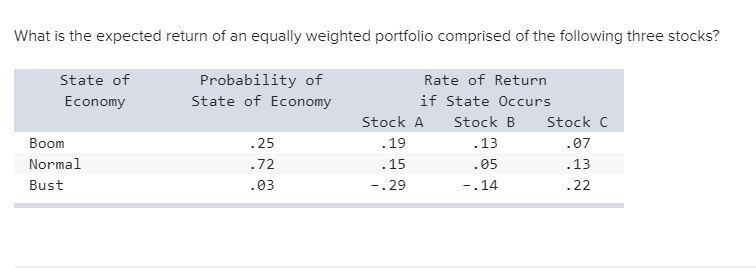

Transcribed Image Text:What is the expected return of an equally weighted portfolio comprised of the following three stocks?
State of
Economy
Probability of
State of Economy
Rate of Return
if State Ocurs
Stock B
Stock A
Stock C
.07
.13
.22
.25
.19
.15
-.29
.13
.05
Boom
Normal
.72
Bust
.03
-.14
Expert Solution
This question has been solved!
Explore an expertly crafted, step-by-step solution for a thorough understanding of key concepts.

This is a popular solution

Trending nowThis is a popular solution!

Step by stepSolved in 3 steps with 2 images

Knowledge Booster


Learn more about
Need a deep-dive on the concept behind this application? Look no further. Learn more about this topic, finance and related others by exploring similar questions and additional content below.Similar questions
- Consider the following information: State of Probability of Economy State of Economy Boom Bust 0.62 0.38 Rate of Return if State Occurs Stock A 0.09 0.20 Stock B 0.17 0.06 Stock C 0.35 -0.10 6 a. What is the expected return on an equally weighted portfolio of these three stocks? (Do not round intermediate calculations. Round the final answer to 2 decimal places.) Expected return % b. What is the variance of a portfolio invested 20% each in A and B and 60% in C? (Do not round intermediate calculations. Roun the final answer to 6 decimal places.) Variancearrow_forwardThe beta coefficient A stock’s contribution to the market risk of a well-diversified portfolio is called Q1. ______risk. It can be measured by a metric called the beta coefficient, which calculates the degree to which a stock moves with the movements in the market. Q2. Based on your understanding of the beta coefficient, indicate whether each statement in the following table is true or false: Statement True False Over time, a stock with a beta of 1.0 produces a return that goes up and down with a 1:1 relationship with the return on the market. Beta measures the volatility in stock movements relative to the market. A stock that is more volatile than the market will have a beta of less than 1.0. Q1. Option 1 Unsystematic or Option 2 Relevant. Please provide true or false answers. Thank you!arrow_forwardConsider the following information on Stocks I and II: State of Economy Recession Normal Irrational exuberance. Probability of State) of Econony 15 .70 .15 a. Stock I beta Stock Il beta. b. Stock I standard deviation Stock Il standard deviation Rate of Return if State Occurs. Stock I Stock II 05 18 07 The market risk premium is 7 percent, and the risk-free rate is 3.5 percent. a. Calculate the beta of each stock. Note: Do not round intermediate calculations and round your answers to 2 decimal places, e.g., 32.16. b. Calculate the standard deviation of each stock. c. More systematic nsk d. More unsystematic risk e. "Riskier stock Note: Do not round intermediate calculations and enter your answers as a percent rounded to 2 decimal places, e.g., 32.16. c. Which stock has the most systematic risk? d. Which one has the most unsystematic risk? e. Which stock is "riskler"? -.21 .10 39 % %arrow_forward
- 2. Consider the following expected returns, volatilities, and correlations: Expected Standard Stock Return Deviation Correlation with Vital Correlation with Mital Correlation with Pital Vital 14% 6% 1.0 -1.0 0.0 Mital 44% 24% -1.0 1.0 0.7 Pital 23% 14% 0.0 0.7 1.0 a. Imagine a portfolio comprising solely of Vital and Mital. What portion of should be allocated to Vital stock to ensure a risk-free investment? your investment b. What is the portfolio's volatility when holding a $10,000 long position in Pital and a $2000 short position in Mital? wwwww c. In a market, there are two securities, Artis and Brotis. Currently, the price of Artis stands at £50. Looking ahead, the price of Artis next year will be £40 during a recession, £55 in normal economic times, and £60 in an expanding economy. The probabilities associated with recession, normal times, and expansion are 0.1, 0.8, and 0.1, respectively. Artis does not pay dividends and has a correlation of 0.8 with the market. On the other…arrow_forwardRead the information for 3 stocks X, Y and Z below. Rate of return when state occurs (For Stock X, Y, and Z) State of Economy Probability of State Stock X Stock Y Stock Z Boom 0.3 0.4 0.45 0.6 Normal 0.5 0.2 0.15 0.08 Recession 0.2 0 -0.3 -0.4 If your portfolio includes 35 percent of X, 40 percent of Y and 25 percent of Z, answerthe following questions: (a) Calculate the portfolio expected return.(b) Calculate the variance and the standard deviation of the portfolio (c) If the expected T-bill rate is 3.80 percent, calculate the expected risk premiumon the portfolio.arrow_forwardQUESTION 1 Consider the following information on stocks I and II: State of probability of Rate of Return if state Occurs state of Econ. Stock I Stock II 0.20 0.06 0.55 0.47 0.25 0.23 The market risk premium is 8%, and the risk free rate is 6%. Economy Recession Normal Boom a) Which stock has the most Systematic risk? b) Which one has the most unsystematic risk? c) Which stock is "riskier"? Explain. -0.25 0.11 0.68arrow_forward
- Consider the following information: Rate of Return if State Occurs Probability of State State of Economy of Economy Stock A Stock B Stock C Boom .10 34 44 24 Good .60 .19 15 08 Poor .25 -.01 09 -.07 Bust .05 -15 -.19 -11 a. Your portfolio is invested 25 percent each in A and C, and 50 percent in B. What is the expected return of the portfolio? (Do not round intermediate calculations and enter your answer as a percent rounded to 2 decimal places, e.g., 32.16.) b-1. What is the variance of this portfolio? (Do not round intermediate calculations and round your answer to 5 decimal places, e.g., .16161.) b-2. What is the standard deviation? (Do not round intermediate calculations and enter your answer as a percent rounded to 2 decimal places, e.g., 32.16.) a. Expected return b-1. Variance % b-2. Standard deviation %arrow_forwardYou've estimated the following expected returns for a stock, depending on the strength of the economy: State (s) Probability Expected return Recession 0.1 -0.05 Normal 0.5 0.06 Expansion 0.4 0.11 What is the expected return for the stock? What is the standard deviation of returns for the stock?arrow_forwardhow much of your capital (what weight) would you invest in stock A to maximize your portfolio's expected return per unit risk (maximize the Sharpe Ratio)?arrow_forward
- Consider the following information: State of Economy Probability of State of Economy Boom Bust .72 .28 a. Expected return b. Variance of portfolio Rate of Return if State Occurs Stock A Stock B .04 .25 13.73 % .10 .19 a. What is the expected return on an equally weighted portfolio of these three stocks? Note: Do not round intermediate calculations and enter your answer as a percent rounded to 2 decimal places, e.g., 32.16. b. What is the variance of a portfolio invested 27 percent each in A and B and 46 percent in C? Note: Do not round intermediate calculations and round your answer to 5 decimal places, e.g., .16161. Stock C .30 -.10arrow_forwardWhich of the following stocks is a better buy? What is the difference between expected return and required return for the best stock? Scenario Probability Stock A Stock B Market Risk-free rate Bust 0.25 -0.15 -0.05 Normal 0.55 0.2 0.1 Boom 0.2 0.4 0.3 Beta 1.2 0.9 Expected return 0.13 0.05arrow_forwardConsider the following information: Rate of Return if State Occurs State of Economy Probability of State of Economy Boom Bust .66 .34 Stock A .09 .23 Stock B .03 Stock C .34 .29 -.14 a. What is the expected return on an equally weighted portfolio of these three stocks? Note: Do not round intermediate calculations and enter your answer as a percent rounded to 2 decimal places, e.g., 32.16. b. What is the variance of a portfolio invested 21 percent each in A and B and 58 percent in C? Note: Do not round intermediate calculations and round your answer to 5 decimal places, e.g., .16161. a. Expected return b. Variance of portfolio 14.43 %arrow_forward
arrow_back_ios
SEE MORE QUESTIONS
arrow_forward_ios
Recommended textbooks for you
- Essentials Of InvestmentsFinanceISBN:9781260013924Author:Bodie, Zvi, Kane, Alex, MARCUS, Alan J.Publisher:Mcgraw-hill Education,


 Foundations Of FinanceFinanceISBN:9780134897264Author:KEOWN, Arthur J., Martin, John D., PETTY, J. WilliamPublisher:Pearson,
 Fundamentals of Financial Management (MindTap Cou...FinanceISBN:9781337395250Author:Eugene F. Brigham, Joel F. HoustonPublisher:Cengage Learning
 Corporate Finance (The Mcgraw-hill/Irwin Series i...FinanceISBN:9780077861759Author:Stephen A. Ross Franco Modigliani Professor of Financial Economics Professor, Randolph W Westerfield Robert R. Dockson Deans Chair in Bus. Admin., Jeffrey Jaffe, Bradford D Jordan ProfessorPublisher:McGraw-Hill Education
Essentials Of Investments
Finance
ISBN:9781260013924
Author:Bodie, Zvi, Kane, Alex, MARCUS, Alan J.
Publisher:Mcgraw-hill Education,
Foundations Of Finance
Finance
ISBN:9780134897264
Author:KEOWN, Arthur J., Martin, John D., PETTY, J. William
Publisher:Pearson,
Fundamentals of Financial Management (MindTap Cou...
Finance
ISBN:9781337395250
Author:Eugene F. Brigham, Joel F. Houston
Publisher:Cengage Learning
Corporate Finance (The Mcgraw-hill/Irwin Series i...
Finance
ISBN:9780077861759
Author:Stephen A. Ross Franco Modigliani Professor of Financial Economics Professor, Randolph W Westerfield Robert R. Dockson Deans Chair in Bus. Admin., Jeffrey Jaffe, Bradford D Jordan Professor
Publisher:McGraw-Hill Education