
MATLAB: An Introduction with Applications
6th Edition
ISBN: 9781119256830
Author: Amos Gilat
Publisher: John Wiley & Sons Inc
expand_more
expand_more
format_list_bulleted
Related questions
Question
Solve all subpart please
other wise dont
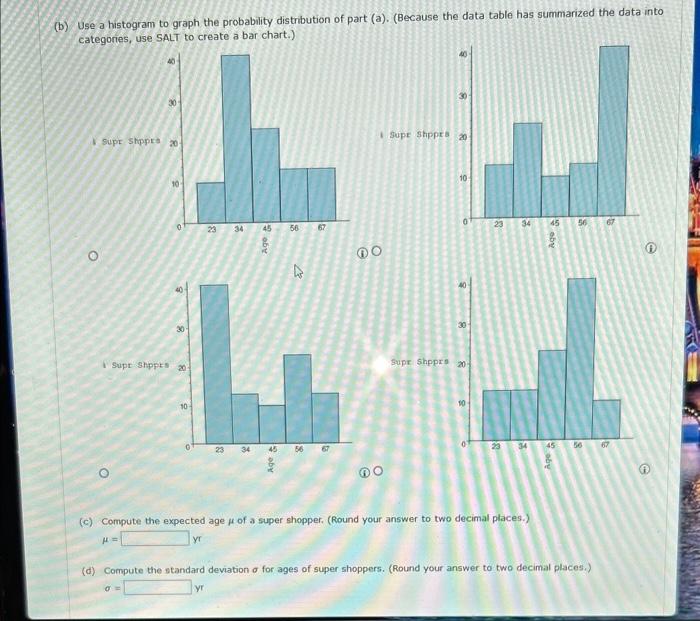

Transcribed Image Text:(b) Use a histogram to graph the probability distribution of part (a). (Because the data table has summarized the data into
categories, use SALT to create a bar chart.).
O
O
8
Supr Shppra 201
30
0
0
Supt Shppts 20
10-
23 34
23 34
45
Age
Age t
56
13
45 56
67
67
DO
Supe Shppes 20
10
0
40
30
Supe Shpprs 20
10-
23 34 45
23
34 45
(c) Compute the expected age of a super shopper. (Round your answer to two decimal places.)
H=
yr
aby
56
56
(d) Compute the standard deviation o for ages of super shoppers. (Round your answer to two decimal places.)
yr
67
67
0
f

Transcribed Image Text:What is the age distribution of promotion-sensitive shoppers? A supermarket super shopper is defined as a shopper for whom
at least 70% of the items purchased were on sale or purchased with a coupon.
18-28 29-39 40-50
Age range, years
Midpoint x
Percent of super shoppers 10%
LUSE SALT
23
34
41%
45
51-61
56
23% 13%
62 and over
67
O Yes. The events are distinct and the probabilities sum to 1.
O No. The events are indistinct and the probabilities to more than 1.
O Yes. The events are distinct and the probabilities do not sum to 1.
O Yes. The events are indistinct and the probabilities sum to less than 1.
13%
For the 62-and-over group, use the midpoint 67 years.
(a) Using the age midpoints x and the percentage of super shoppers, do we have a valid probability distribution? Explain.
O No. The events are distinct and the probabilities sum to 1.
(b) Use a histogram to graph the probability distribution of part (a). (Because the data table has summarized the data into
categories, use SALT to create a bar chart.)
Expert Solution
This question has been solved!
Explore an expertly crafted, step-by-step solution for a thorough understanding of key concepts.

Step by stepSolved in 5 steps with 1 images

Knowledge Booster

Similar questions
- A researcher wants to see if there is a difference in APGAR scores of newborns depending on whether the mother smoked during pregnancy or not. She collects data and analyzes the results using SPSS. What is the correct way to report the results in APA style? Question 23 options: t(58) = 3.288, p>.05 t(58) = 3.288, p= .002 t(26.5) = 3.278, p<.05 t(26.5) =3.278, p=.003arrow_forwardPlease do not give solution in image format thanku A committee of 6 U.S. senators is to be formed with 3 Democrats and 3 Republicans. In how many ways can this be done if there are 39 Democratic senators and 61 Republican senators?arrow_forwardSolution setarrow_forward
arrow_back_ios
arrow_forward_ios
Recommended textbooks for you
- MATLAB: An Introduction with ApplicationsStatisticsISBN:9781119256830Author:Amos GilatPublisher:John Wiley & Sons Inc
 Probability and Statistics for Engineering and th...StatisticsISBN:9781305251809Author:Jay L. DevorePublisher:Cengage Learning
 Statistics for The Behavioral Sciences (MindTap C...StatisticsISBN:9781305504912Author:Frederick J Gravetter, Larry B. WallnauPublisher:Cengage Learning
  Elementary Statistics: Picturing the World (7th E...StatisticsISBN:9780134683416Author:Ron Larson, Betsy FarberPublisher:PEARSON
 The Basic Practice of StatisticsStatisticsISBN:9781319042578Author:David S. Moore, William I. Notz, Michael A. FlignerPublisher:W. H. Freeman
 Introduction to the Practice of StatisticsStatisticsISBN:9781319013387Author:David S. Moore, George P. McCabe, Bruce A. CraigPublisher:W. H. Freeman
MATLAB: An Introduction with Applications
Statistics
ISBN:9781119256830
Author:Amos Gilat
Publisher:John Wiley & Sons Inc
Probability and Statistics for Engineering and th...
Statistics
ISBN:9781305251809
Author:Jay L. Devore
Publisher:Cengage Learning
Statistics for The Behavioral Sciences (MindTap C...
Statistics
ISBN:9781305504912
Author:Frederick J Gravetter, Larry B. Wallnau
Publisher:Cengage Learning
Elementary Statistics: Picturing the World (7th E...
Statistics
ISBN:9780134683416
Author:Ron Larson, Betsy Farber
Publisher:PEARSON
The Basic Practice of Statistics
Statistics
ISBN:9781319042578
Author:David S. Moore, William I. Notz, Michael A. Fligner
Publisher:W. H. Freeman
Introduction to the Practice of Statistics
Statistics
ISBN:9781319013387
Author:David S. Moore, George P. McCabe, Bruce A. Craig
Publisher:W. H. Freeman