
ENGR.ECONOMIC ANALYSIS
14th Edition
ISBN: 9780190931919
Author: NEWNAN
Publisher: Oxford University Press
expand_more
expand_more
format_list_bulleted
Related questions
Question
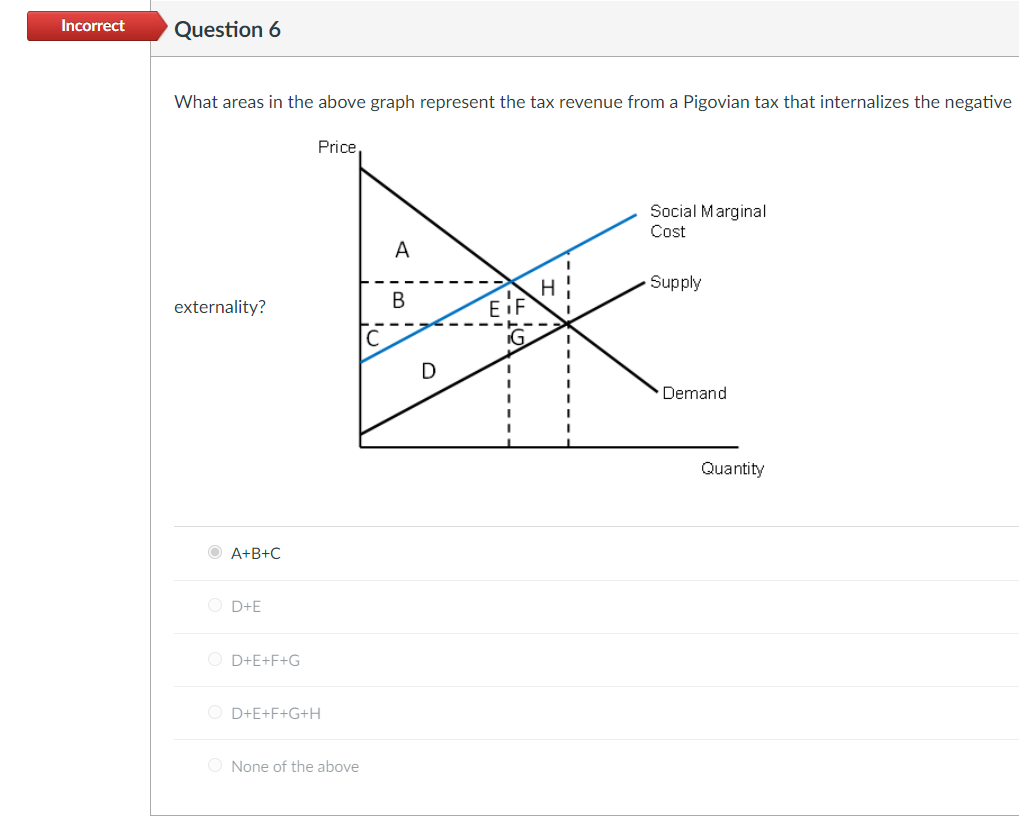

Transcribed Image Text:Incorrect
Question 6
What areas in the above graph represent the tax revenue from a Pigovian tax that internalizes the negative
Price,
Social Marginal
Cost
A
Supply
externality?
EIF
Demand
Quantity
A+B+C
O D+E
O D+E+F+G
O D+E+F+G+H
O None of the above
Expert Solution
This question has been solved!
Explore an expertly crafted, step-by-step solution for a thorough understanding of key concepts.

This is a popular solution

Trending nowThis is a popular solution!

Step by stepSolved in 2 steps

Knowledge Booster


Learn more about
Need a deep-dive on the concept behind this application? Look no further. Learn more about this topic, economics and related others by exploring similar questions and additional content below.Similar questions
- Which of the following will most likely lead to the smallest deadweight loss (all else equal)? Select one: A. A payroll tax of $10 B. A mandated benefit that costs $15 and employees value at $4 C. A payroll tax of $7 D. A subsidy of $13 E. A mandated benefit that costs $9 and employees value at $3 O O O Oarrow_forwardWhat is Producer Surplus at a price of $5? Price 12 10 8 6 42 Quantity Demanded 1 2 WN 3 456 Quantity Supplied 6 5 4 3 2 1arrow_forwardTable 2: Market for Skis P 0 4 8 12 16 Qd Qs 15 0 12 9 6 3 20 0 6 12 12 16 20 2. Consider Table 2. a. What is the equilibrium price and quantity? b. What is the CS, PS, and TS? C. If there is a $3 tax, what is the equilibrium price buyers pay, the price sellers receive, and the quantity?arrow_forward
- If there is a $3 tax, what is the equilibrium price buyers pay, the price sellers receive, and the quantity? If there is a $3 tax, what is the CS, PS, tax revenue, TS, and deadweight loss? Include graph!arrow_forwarduncements us es $10 Materials $7 -Hill $5 49 sources 20 30 D Q If this market has a tax of $5 per unit imposed on it, what is the Deadweight Loss? O $7 O $25 O $30 O $100 IT * zoomarrow_forwardSuppose the graph shows the market for wheat. The equilibrium price is $25. To support incomes of farmers, the government imposes a price floor of $35. What is the cost of the program borne by the government? 50 45 40 35 30 25 20 15 10 5 Price - 100 200 300 400 500 600 700 800 Quantity Multiple Choice O O $14.000 $12.000 $21,000 $15,000arrow_forward
- i will 10 upvotes do fast .arrow_forwardThe graph shown portrays a subsidy to buyers. After the subsidy is in place, the post-subsidy price paid by buyers is post-subsidy price received by sellers is _________ the difference between these two figures is the amount of_ P 46 40 30 24 A $30; $46; the subsidy (B) $24; $40; government revenue C$24; $40; the subsidy (D) $40; $24; the subsidy E₁ 100 E2 150 S -D2 D. and thearrow_forward37 $50 Supply $40 t of $30 E $20 F Price $10 Ceiling Demand $0 40 80 120 160 200 Quantity In the market shown in the diagram above, the government has imposed a Price Ceiling at $10. Assuming the original equilibrium at point E was socially optimal, the Deadweight Loss from the Price Ceiling would be Select one: а. $800 b. $200 c. $100 d. $400 Pricearrow_forward
- Refer to the figure. Price (dollars) 10 9 8 7 6 4 B 2 1 Market for Artichokes 50 100 D 150 S 200 Quantity (pounds of artichokes) 250 Tools DL e Suppose the local farmers' market sets a minimum price of $6 per pound that farmers can charge for artichokes. The supply and demand for artichokes is described in the graph above. Using the graph, show the resulting deadweight loss from the new minimum price, and then determine the amount of the deadweight loss as a result of the pricing policy. Instructions. Use the tool provided "DL to illustrate this area on the graph. Ceadweight lose: $arrow_forwardpart C and D i need it in word not handwritten solutionarrow_forwardFigure 1. The graph depicts the market for plastic containers. Price 16- 14- 12- 10 8- 6 200 500 650 Social Cost Private Cost Demand Quantity Refer to Figure 1. In order to reach the social optimum, the government could O offer a subsidy of $8 per unit on the production of plastic containers. O impose a tax of $8 per unit on the production of plastic containers. O offer a subsidy of $4 per unit on the production of plastic containers. O impose a tax of $4 per unit on the production of plastic containers.arrow_forward
arrow_back_ios
SEE MORE QUESTIONS
arrow_forward_ios
Recommended textbooks for you
 Principles of Economics (12th Edition)EconomicsISBN:9780134078779Author:Karl E. Case, Ray C. Fair, Sharon E. OsterPublisher:PEARSON
 Engineering Economy (17th Edition)EconomicsISBN:9780134870069Author:William G. Sullivan, Elin M. Wicks, C. Patrick KoellingPublisher:PEARSON
 Principles of Economics (MindTap Course List)EconomicsISBN:9781305585126Author:N. Gregory MankiwPublisher:Cengage Learning
 Managerial Economics: A Problem Solving ApproachEconomicsISBN:9781337106665Author:Luke M. Froeb, Brian T. McCann, Michael R. Ward, Mike ShorPublisher:Cengage Learning
 Managerial Economics & Business Strategy (Mcgraw-...EconomicsISBN:9781259290619Author:Michael Baye, Jeff PrincePublisher:McGraw-Hill Education
Principles of Economics (12th Edition)
Economics
ISBN:9780134078779
Author:Karl E. Case, Ray C. Fair, Sharon E. Oster
Publisher:PEARSON
Engineering Economy (17th Edition)
Economics
ISBN:9780134870069
Author:William G. Sullivan, Elin M. Wicks, C. Patrick Koelling
Publisher:PEARSON
Principles of Economics (MindTap Course List)
Economics
ISBN:9781305585126
Author:N. Gregory Mankiw
Publisher:Cengage Learning
Managerial Economics: A Problem Solving Approach
Economics
ISBN:9781337106665
Author:Luke M. Froeb, Brian T. McCann, Michael R. Ward, Mike Shor
Publisher:Cengage Learning
Managerial Economics & Business Strategy (Mcgraw-...
Economics
ISBN:9781259290619
Author:Michael Baye, Jeff Prince
Publisher:McGraw-Hill Education