MATLAB: An Introduction with Applications
6th Edition
ISBN: 9781119256830
Author: Amos Gilat
Publisher: John Wiley & Sons Inc
expand_more
expand_more
format_list_bulleted
Question
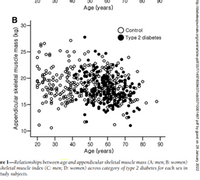
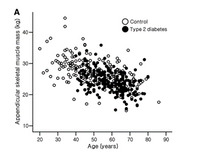
What are the CI=confidence interval, OR = odds ratio, P value=probability of null value hypothesis from the following scatter graphs. The data collected aims to show the association between diabetes and muscle loss.

Transcribed Image Text:Ape (years)
Control
Type 2 diabetes
15-
20
50
70
80
90
Age lyears)
rel-Relarionships benween agrand appendicular sheletal muscle mass (A men women)
krletal mascle index (C men, D: women) acress category of ope 2 diabetes for cach sex in
ady sahjects.
Appendicular skeletal muscle mass ka) 0
pd morgia epameo ad00 dyt y

Transcribed Image Text:Control
Type 2 diabetes
30-
00
10-
20
30
40
50
60
70
80
90
Age (years)
Appendicular skeletal muscle mass (kg) >
Expert Solution
This question has been solved!
Explore an expertly crafted, step-by-step solution for a thorough understanding of key concepts.
Step by stepSolved in 2 steps

Knowledge Booster
Similar questions
- A phase three clinical trail for a new medication proposed to treat depression has 1191 participants. If all these individuals are from the group of individuals who were given the medication and 759 individuals who received the medication experienced improvement in their symptoms of depression, construct a 90% confidence interval for the true proportion of individuals on the medication who experienced improvement in their symptoms of depression.arrow_forwardResearchers studying the spread of an insect called the hemlock woolly adelgid find that the bugs have infested 23% of a random sample of 345 hemlock trees in the study area. What's a 99% confidence interval for the population proportion of infested hemlock trees in the study area?arrow_forwardA Pew Research Center report on gamers and gaming estimated that 49% of U.S. adults play video games on a computer, TV, game console, or portable device such as a cell phone. This estimate was based on a random sample of 2001 U.S. adults! Construct and interpret a 95% confidence interval for the proportion of all U.S. adults who play video games. O We are 95% confident that the interval from 0.472 to 0.509 captures p = the proportion of adults in the Pew Research Center report who play video games. O We are 95% confident that the interval from 0.472 to 0.509 captures p = the true proportion of U.S. adults who play video games. We are 95% confident that the interval from 0.468 to 0.512 captures p = the true proportion of U.S. adults who play video games. O We are 95% confident that the interval from 0.468 to 0.512 captures p= the proportion of adults in the Pew Research Center report who play video games. O We are 95% confident that the interval from 0.018 to 0.031 captures p = the true…arrow_forward
- In a study of speed dating, male subjects were asked to rate the attractiveness of their female dates, and a sample of the results is listed below (1 = not attractive; 10 = extremely attractive). Construct a confidence interval using a 90% confidence level. What do the results tell about the mean attractiveness ratings of the population of all adult females?7,7,1,8,6,5,8,8,8,8,5,9 What is the confidence interval for the population mean u? __<u<__ (Round to one decimal place as needed.)arrow_forwardAccording to the website www.collegedrinkingprevention.gov, "About 25 percent of college students report academic consequences of their drinking including missing class, falling behind, doing poorly on exams or papers, and receiving lower grades overall." A statistics student is curious about drinking habits of students at his college. He wants to estimate the mean number of alcoholic drinks consumed each week by students at his college. He plans to use a 90% confidence interval. He surveys a random sample of 63 students. The sample mean is 3.7 alcoholic drinks per week. The sample standard deviation is 3.2 drinks. Construct the 90% confidence interval to estimate the average number of alcoholic drinks consumed each week by students at this college. 1. The t value is - 2. The standard error has a value of -- 3. The margin of error has a value of 4. Construct the 90% confidence interval to estimate the average number of alcoholic drinks consumed each week by students at this college.arrow_forwardResearchers are studying whether the proportion of homeschooled children in district 1 (considered 1) is less than the proportion of homeschooled children in neighboring district 2 (considered as 2). To test the theory info was gathered: district 1 had 600 students of which 90 were homeschooled. District 2 had 550 students of which 99 were homeschooled. What is the 95% confidence interval for the difference proportion between district 1 and 2? A. (-0.086, 0.026) B. (0.143, 0.217) C. (0.113, 0.187)arrow_forward
- A phase three clinical trial for a new medication proposed to treat depression has 1191 participants. If all these individuals are from the group of individuals who were given the medication and 759 individuals who received the medication experienced improvement in their symptoms of depression, construct a 90% confidence interval for the true proportion of individuals on the medication who experienced improvement in their symptoms of depression.arrow_forwarducation.com/ext/map/index.html AD Facebook YouTube E Home - » Students Rater Hub U Mari'a Sweet 2001... 0 ASUS Wireless Rout... O Microsoft Office Ho... Appen Projects Saved Help Save & Exit Submit Scores on an accounting exam ranged from 44 to 91, with quartiles Q1= 54.25, Q2=61.5, and Q3=79.25. (a) Select the correct box plot for the given data. BoxPlot A BoxPlot B BoxPlot BoxPlot 40 50 60 70 80 90 100 40 50 60 70 80 AO:BoxPlot A BoxPlot B BoxPlot C (b) Describe its shape (skewed left, symmetric, skewed right). The distribution is symmetric. The distribution is skewed left. OThe dictrihution ic ckewed rinht ch 1:01 10/25/arrow_forward
arrow_back_ios
arrow_forward_ios
Recommended textbooks for you
 MATLAB: An Introduction with ApplicationsStatisticsISBN:9781119256830Author:Amos GilatPublisher:John Wiley & Sons Inc
 Probability and Statistics for Engineering and th...StatisticsISBN:9781305251809Author:Jay L. DevorePublisher:Cengage Learning
 Statistics for The Behavioral Sciences (MindTap C...StatisticsISBN:9781305504912Author:Frederick J Gravetter, Larry B. WallnauPublisher:Cengage Learning
 Elementary Statistics: Picturing the World (7th E...StatisticsISBN:9780134683416Author:Ron Larson, Betsy FarberPublisher:PEARSON
 The Basic Practice of StatisticsStatisticsISBN:9781319042578Author:David S. Moore, William I. Notz, Michael A. FlignerPublisher:W. H. Freeman
 Introduction to the Practice of StatisticsStatisticsISBN:9781319013387Author:David S. Moore, George P. McCabe, Bruce A. CraigPublisher:W. H. Freeman

MATLAB: An Introduction with Applications
Statistics
ISBN:9781119256830
Author:Amos Gilat
Publisher:John Wiley & Sons Inc

Probability and Statistics for Engineering and th...
Statistics
ISBN:9781305251809
Author:Jay L. Devore
Publisher:Cengage Learning

Statistics for The Behavioral Sciences (MindTap C...
Statistics
ISBN:9781305504912
Author:Frederick J Gravetter, Larry B. Wallnau
Publisher:Cengage Learning

Elementary Statistics: Picturing the World (7th E...
Statistics
ISBN:9780134683416
Author:Ron Larson, Betsy Farber
Publisher:PEARSON

The Basic Practice of Statistics
Statistics
ISBN:9781319042578
Author:David S. Moore, William I. Notz, Michael A. Fligner
Publisher:W. H. Freeman

Introduction to the Practice of Statistics
Statistics
ISBN:9781319013387
Author:David S. Moore, George P. McCabe, Bruce A. Craig
Publisher:W. H. Freeman