Glencoe Algebra 1, Student Edition, 9780079039897, 0079039898, 2018
18th Edition
ISBN: 9780079039897
Author: Carter
Publisher: McGraw Hill
expand_more
expand_more
format_list_bulleted
Question

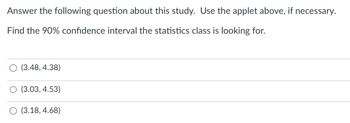
Transcribed Image Text:Answer the following question about this study. Use the applet above, if necessary.
Find the 90% confidence interval the statistics class is looking for.
(3.48, 4.38)
(3.03, 4.53)
(3.18, 4.68)

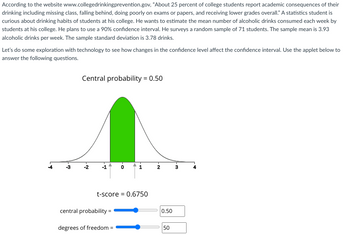
Transcribed Image Text:According to the website www.collegedrinkingprevention.gov, "About 25 percent of college students report academic consequences of their
drinking including missing class, falling behind, doing poorly on exams or papers, and receiving lower grades overall." A statistics student is
curious about drinking habits of students at his college. He wants to estimate the mean number of alcoholic drinks consumed each week by
students at his college. He plans to use a 90% confidence interval. He surveys a random sample of 71 students. The sample mean is 3.93
alcoholic drinks per week. The sample standard deviation is 3.78 drinks.
Let's do some exploration with technology to see how changes in the confidence level affect the confidence interval. Use the applet below to
answer the following questions.
-♡
Central probability = 0.50
-Ņ
A
t-score = 0.6750
central probability =
degrees of freedom =
N
0.50
50
-♡2₂
3
Expert Solution
This question has been solved!
Explore an expertly crafted, step-by-step solution for a thorough understanding of key concepts.
Step by stepSolved in 2 steps

Knowledge Booster
Similar questions
- Can I get help with this question.arrow_forwardAccording to the website www.collegedrinkingprevention.gov, "About 25 percent of college students report academic consequences of their drinking including missing class, falling behind, doing poorly on exams or papers, and receiving lower grades overall." A statistics student is curious about drinking habits of students at his college. He wants to estimate the mean number of alcoholic drinks consumed each week by students at his college. He plans to use a 90% confidence interval. He surveys a random sample of 63 students. The sample mean is 3.7 alcoholic drinks per week. The sample standard deviation is 3.2 drinks. Construct the 90% confidence interval to estimate the average number of alcoholic drinks consumed each week by students at this college. 1. The t value is - 2. The standard error has a value of -- 3. The margin of error has a value of 4. Construct the 90% confidence interval to estimate the average number of alcoholic drinks consumed each week by students at this college.arrow_forwardA psychological study wants to analyze the relationship between anxiety and binge drinking; a questionnaire for anxiety and questionnaire for binge drinking is administered to each subject. What would be a good statistical test to test the hypothesis?arrow_forward
- A survey of 97 random homeowners in my neighborhood had a mean of $720 spent on lawn care. Construct a 98% confidence interval for the mean lawn care expenditure per household when the population variance is $400.arrow_forwardIn a 2015 study entitled How Undergraduate Students Use Credit Cards, it was reported that undergraduate students have a mean credit card balance higher than $3000. This figure was an all-time high and had increased 42% over the previous five years. Assume that a current study is being conducted to determine if it can be concluded that the mean credit card balance for undergraduate students has continued to increase compared to the report. They want to test to see if the balance for students in 2019 is higher than the balance for students in 2015. See the sample below of undergraduate students in 2015 and different undergraduate students in 2019. Undergraduate Credit Cards Students in 2015 Students in 2019 2500 3300 2200 5450 1500 8000 930 2000 5300 870 1150 250 2700 3000 3300 2200 What is the t-statistic for this t-test?arrow_forwardIn a 2015 study entitled How Undergraduate Students Use Credit Cards, it was reported that undergraduate students have a mean credit card balance higher than $3000. This figure was an all-time high and had increased 42% over the previous five years. Assume that a current study is being conducted to determine if it can be concluded that the mean credit card balance for undergraduate students has continued to increase compared to the report. They want to test to see if the balance for students in 2019 is higher than the balance for students in 2015. See the sample below of undergraduate students in 2015 and different undergraduate students in 2019. Credit Card Increase Students in 2015 Students in 2019 2500 3300 2200 5450 1500 8000 930 2000 5300 870 1150 250 2700 3000 3300 2200 What can we conclude from this t-test? a) Reject the null hypotesis OR Fail to reject the null hypotesis? b) We can conclude that the student balance in 2019 are significatly…arrow_forward
- Question 4 According to the website www.collegedrinkingprevention.gov, "About 25 percent of college students report academic consequences of their drinking including missing class, falling behind, doing poorly on exams or papers, and receiving lower grades overall." A statistics student is curious about drinking habits of students at his college. He wants to estimate the mean number of alcoholic drinks consumed each week by students at his college. He plans to use a 90% confidence interval. He surveys a random sample of 56 students. The sample mean is 3.94 alcoholic drinks per week. The sample standard deviation is 3.43 drinks. Construct the 90% confidence interval to estimate the average number of alcoholic drinks consumed each week by students at this college. ( Your answer should be rounded to 2 decimal places.arrow_forwardA nationwide job recruiting firm wants to compare the annual incomes for childcare workers in Utah and Oregon. Due to recent trends in the childcare industry, the firm suspects that the mean annual income of childcare workers in Utah is less than the mean annual income of childcare workers in Oregon. To see if this is true, the firm selected a random sample of 20 childcare workers from Utah and an independent random sample of 20 childcare workers from Oregon and asked them to report their mean annual income. The data obtained were as follows. Annual income in dollars 27060 , 42320, 36445 , 37895 , 44564 , 35325 , 30313 , 28698 , 33706, 48365 , 26946 , 25063 , 28339 , 29265 , 40051 37026 , 40150, 42753 Utah 27820, 39471 29769, 48859, 32480 , 36288 45102 , 46219 , 51098 , 45516 , 38834 44659 , 40755 , 38006 , 39947 , 29801, 32200 38731 , 41370 , 28059 , 33753 , 35271 Oregon Send data to calc... v Send data to Excel The population standard deviation for the annual incomes of childcare…arrow_forwardA nationwide job recruiting firm wants to compare the annual incomes for childcare workers in Utah and Oregon. Due to recent trends in the childcare industry, the firm suspects that the mean annual income of childcare workers in Utah is less than the mean annual income of childcare workers in Oregon. To see if this is true, the firm selected a random sample of 20 childcare workers from Utah and an independent random sample of 20 childcare workers from Oregon and asked them to report their mean annual income. The data obtained were as follows. Annual income in dollars 27060 , 42320 , 36445 , 37895, 44564 , 35325 , 30313 , 28698, 33706 , 48365 , 26946 , 25063 , 28339 , 29265 , 40051 , 37026 , 40150 , 42753 , 27820, 39471 Utah 29769 , 48859 , 32480 , 36288,45102 , 46219 ,51098 , 45516 , 38834 , 44659 , 40755 , 38006 , 39947 , 29801 , 32200, 38731 , 41370 , 28059 , 33753 , 35271 Oregon Send data to calc... v Send data to Excel The population standard deviation for the annual incomes of…arrow_forward
arrow_back_ios
SEE MORE QUESTIONS
arrow_forward_ios
Recommended textbooks for you
 Glencoe Algebra 1, Student Edition, 9780079039897...AlgebraISBN:9780079039897Author:CarterPublisher:McGraw Hill
 Big Ideas Math A Bridge To Success Algebra 1: Stu...AlgebraISBN:9781680331141Author:HOUGHTON MIFFLIN HARCOURTPublisher:Houghton Mifflin Harcourt
 College Algebra (MindTap Course List)AlgebraISBN:9781305652231Author:R. David Gustafson, Jeff HughesPublisher:Cengage Learning

Glencoe Algebra 1, Student Edition, 9780079039897...
Algebra
ISBN:9780079039897
Author:Carter
Publisher:McGraw Hill

Big Ideas Math A Bridge To Success Algebra 1: Stu...
Algebra
ISBN:9781680331141
Author:HOUGHTON MIFFLIN HARCOURT
Publisher:Houghton Mifflin Harcourt


College Algebra (MindTap Course List)
Algebra
ISBN:9781305652231
Author:R. David Gustafson, Jeff Hughes
Publisher:Cengage Learning