MATLAB: An Introduction with Applications
6th Edition
ISBN: 9781119256830
Author: Amos Gilat
Publisher: John Wiley & Sons Inc
expand_more
expand_more
format_list_bulleted
Concept explainers
Question

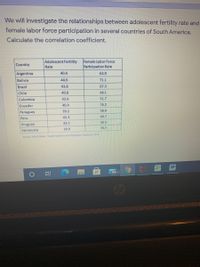
Transcribed Image Text:We will investigate the relationships between adolescent fertility rate and
female labor force participation in several countries of South America.
Calculate the correlation coefficient.
Adolescent Fertility
Rate
Female Labor Force
Participation Rate
Country
Argentina
40.4
63.9
Bolivia
44.6
71.1
Brazil
43.8
67.3
Chile
40.8
48.1
Colombia
42.6
51.7
Ecuador
40.4
76.2
39.2
58.0
Paraguay
45.3
49.7
Peru
44.5
56.5
Uruguay
Venezuela
39.9
79.7
Sorce Wond B Heath Nooon and Popuiabon Sstics 2014
99+
Expert Solution
This question has been solved!
Explore an expertly crafted, step-by-step solution for a thorough understanding of key concepts.
This is a popular solution
Trending nowThis is a popular solution!
Step by stepSolved in 2 steps with 1 images

Knowledge Booster
Learn more about
Need a deep-dive on the concept behind this application? Look no further. Learn more about this topic, statistics and related others by exploring similar questions and additional content below.Similar questions
- What is meant by the statement, "Correlation does not imply causation"? Provide an example to illustrate your explanation.arrow_forwardList two possible limitations of using a Pearson correlation coefficient.arrow_forwardWe made a survey with the number of people in a household and the number of times they get sick throughout the year. In a household, 3 people get sick once, 4 people get sick twice, 2 people get sick three times and 1 person gets sick 4 times. 1) Give the correlation coefficient, proper interpretation of it, and explain the relevance to the topicarrow_forward
- 11. Why doesn't correlation equal causation?arrow_forwardTrue or false .If there is no linear correlation between enrollment and the number of burglaries , then those two variables are not related in anyway. Explain why ?arrow_forwardAn Economics instructor assigns a class to investigate factors associated with the gross domestic product (GDP) of nations. Each student examines a different factor (such as life expectancy, literacy rate, etc.) for a few countries and reports to the class. Apparently, some of the classmates do not understand Statistics very well because several of their conclusions are incorrect. Explain the mistakes in comments a and b below. a) Explain the mistake in the statement "There was a very strong correlation of 1.22 between Life Expectancy and GDP" Choose the correct answer below O A. A correlation cannot be greater than 1. O B. A correlation that is greater than 1 implies that the variables are not quantitative, so the correlation cannot be interpreted. OC. A correlation that is close to 1 implies a very weak correlation. The correlation must be close to 10 for it to be interpreted as a very strong correlation. O D. A correlation that is greater than 1 implies a weak correlation, not a…arrow_forward
arrow_back_ios
arrow_forward_ios
Recommended textbooks for you
 MATLAB: An Introduction with ApplicationsStatisticsISBN:9781119256830Author:Amos GilatPublisher:John Wiley & Sons Inc
 Probability and Statistics for Engineering and th...StatisticsISBN:9781305251809Author:Jay L. DevorePublisher:Cengage Learning
 Statistics for The Behavioral Sciences (MindTap C...StatisticsISBN:9781305504912Author:Frederick J Gravetter, Larry B. WallnauPublisher:Cengage Learning
 Elementary Statistics: Picturing the World (7th E...StatisticsISBN:9780134683416Author:Ron Larson, Betsy FarberPublisher:PEARSON
 The Basic Practice of StatisticsStatisticsISBN:9781319042578Author:David S. Moore, William I. Notz, Michael A. FlignerPublisher:W. H. Freeman
 Introduction to the Practice of StatisticsStatisticsISBN:9781319013387Author:David S. Moore, George P. McCabe, Bruce A. CraigPublisher:W. H. Freeman

MATLAB: An Introduction with Applications
Statistics
ISBN:9781119256830
Author:Amos Gilat
Publisher:John Wiley & Sons Inc

Probability and Statistics for Engineering and th...
Statistics
ISBN:9781305251809
Author:Jay L. Devore
Publisher:Cengage Learning

Statistics for The Behavioral Sciences (MindTap C...
Statistics
ISBN:9781305504912
Author:Frederick J Gravetter, Larry B. Wallnau
Publisher:Cengage Learning

Elementary Statistics: Picturing the World (7th E...
Statistics
ISBN:9780134683416
Author:Ron Larson, Betsy Farber
Publisher:PEARSON

The Basic Practice of Statistics
Statistics
ISBN:9781319042578
Author:David S. Moore, William I. Notz, Michael A. Fligner
Publisher:W. H. Freeman

Introduction to the Practice of Statistics
Statistics
ISBN:9781319013387
Author:David S. Moore, George P. McCabe, Bruce A. Craig
Publisher:W. H. Freeman