MATLAB: An Introduction with Applications
6th Edition
ISBN: 9781119256830
Author: Amos Gilat
Publisher: John Wiley & Sons Inc
expand_more
expand_more
format_list_bulleted
Question

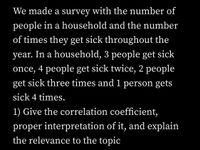
Transcribed Image Text:We made a survey with the number of
people in a household and the number
of times they get sick throughout the
year. In a household, 3 people get sick
once, 4 people get sick twice, 2 people
get sick three times and 1 person gets
sick 4 times.
1) Give the correlation coefficient,
proper interpretation of it, and explain
the relevance to the topic
Expert Solution
This question has been solved!
Explore an expertly crafted, step-by-step solution for a thorough understanding of key concepts.
Step by stepSolved in 2 steps with 2 images

Knowledge Booster
Similar questions
- ab! ourses The accompanying technology output was obtained by using the paired data consisting of foot lengths (cm) and heights (cm) of a sample of 40 people. Along with the paired sample data, the technology was also given a foot length of 13.6 cm to be used for predicting height. The technology found that there is a linear correlation between height and foot length. If someone has a foot length of 13.6 cm, what is the single value that is the best predicted height for that person? "se Hom E Click the icon to view the technology output. abus The single value that is the best predicted height is cm. endar (Round to the nearest whole number as needed.) entation ktbook a-F on unouncem ssignment: cudy Plan radebook Hydrogen Report.pdf Enter your answer in the answer box. Screen Shot 20-11...9.53 P 5,981 10 tv MacBook Pro (5arrow_forwardExplain correlation and its importance.arrow_forwardTrue or false .If there is no linear correlation between enrollment and the number of burglaries , then those two variables are not related in anyway. Explain why ?arrow_forward
- What are some of the possible reasons for large correlations betwen a pair of variables, X and Y?arrow_forwardOne professor who teaches statistics gave students one homework assignment. He asked students to find a two-variable data set and compute the Pearson correlation coefficient. One student found a data set: one variable is students' midterm test score in an introductory microeconomics class and total observations are 45 students; while the other one variable is also students' midterm test score in another introductory microeconomics class and total observations are 57 students. Both of these two classes were taught by the same instructor in spring 2018. Does this student's data set make sense? Why or why not? Discuss and explain your reasons. You must provide your statistical analysis and reasons.arrow_forwardAn Economics instructor assigns a class to investigate factors associated with the gross domestic product (GDP) of nations. Each student examines a different factor (such as life expectancy, literacy rate, etc.) for a few countries and reports to the class. Apparently, some of the classmates do not understand Statistics very well because several of their conclusions are incorrect. Explain the mistakes in comments a and b below. a) Explain the mistake in the statement "There was a very strong correlation of 1.22 between Life Expectancy and GDP" Choose the correct answer below O A. A correlation cannot be greater than 1. O B. A correlation that is greater than 1 implies that the variables are not quantitative, so the correlation cannot be interpreted. OC. A correlation that is close to 1 implies a very weak correlation. The correlation must be close to 10 for it to be interpreted as a very strong correlation. O D. A correlation that is greater than 1 implies a weak correlation, not a…arrow_forward
arrow_back_ios
arrow_forward_ios
Recommended textbooks for you
 MATLAB: An Introduction with ApplicationsStatisticsISBN:9781119256830Author:Amos GilatPublisher:John Wiley & Sons Inc
 Probability and Statistics for Engineering and th...StatisticsISBN:9781305251809Author:Jay L. DevorePublisher:Cengage Learning
 Statistics for The Behavioral Sciences (MindTap C...StatisticsISBN:9781305504912Author:Frederick J Gravetter, Larry B. WallnauPublisher:Cengage Learning
 Elementary Statistics: Picturing the World (7th E...StatisticsISBN:9780134683416Author:Ron Larson, Betsy FarberPublisher:PEARSON
 The Basic Practice of StatisticsStatisticsISBN:9781319042578Author:David S. Moore, William I. Notz, Michael A. FlignerPublisher:W. H. Freeman
 Introduction to the Practice of StatisticsStatisticsISBN:9781319013387Author:David S. Moore, George P. McCabe, Bruce A. CraigPublisher:W. H. Freeman

MATLAB: An Introduction with Applications
Statistics
ISBN:9781119256830
Author:Amos Gilat
Publisher:John Wiley & Sons Inc

Probability and Statistics for Engineering and th...
Statistics
ISBN:9781305251809
Author:Jay L. Devore
Publisher:Cengage Learning

Statistics for The Behavioral Sciences (MindTap C...
Statistics
ISBN:9781305504912
Author:Frederick J Gravetter, Larry B. Wallnau
Publisher:Cengage Learning

Elementary Statistics: Picturing the World (7th E...
Statistics
ISBN:9780134683416
Author:Ron Larson, Betsy Farber
Publisher:PEARSON

The Basic Practice of Statistics
Statistics
ISBN:9781319042578
Author:David S. Moore, William I. Notz, Michael A. Fligner
Publisher:W. H. Freeman

Introduction to the Practice of Statistics
Statistics
ISBN:9781319013387
Author:David S. Moore, George P. McCabe, Bruce A. Craig
Publisher:W. H. Freeman