
MATLAB: An Introduction with Applications
6th Edition
ISBN: 9781119256830
Author: Amos Gilat
Publisher: John Wiley & Sons Inc
expand_more
expand_more
format_list_bulleted
Related questions
Question
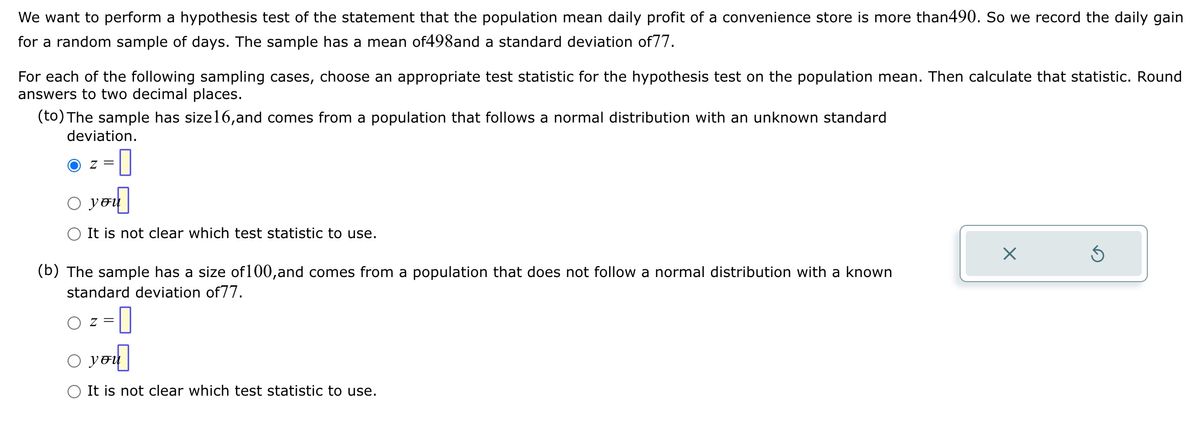

Transcribed Image Text:We want to perform a hypothesis test of the statement that the population mean daily profit of a convenience store is more than490. So we record the daily gain
for a random sample of days. The sample has a mean of498and a standard deviation of77.
For each of the following sampling cases, choose an appropriate test statistic for the hypothesis test on the population mean. Then calculate that statistic. Round
answers to two decimal places.
(to) The sample has size16,and comes from a population that follows a normal distribution with an unknown standard
deviation.
● z = I
о
you
It is not clear which test statistic to use.
(b) The sample has a size of 100,and comes from a population that does not follow a normal distribution with a known
standard deviation of77.
Z
z=0
o
you
It is not clear which test statistic to use.
X
Ś
Expert Solution
This question has been solved!
Explore an expertly crafted, step-by-step solution for a thorough understanding of key concepts.

Step by stepSolved in 4 steps with 3 images

Knowledge Booster

Similar questions
- A fitness center bought a new exercise machine called the Mountain Climber. They decided to keep track of how many people used the machine over a 3-hour period. Here X is the number of people who used the machine. X 0 1 2 3 4 PX 0.2 0.2 0.1 0.4 0.1 Find the mean,variance and standard deviationarrow_forwardOne of the z-score formulas will help on this question. Scores on the SAT test are normally distributed with a mean of 500 and standard deviation of 100 points. Pretend someone scored 400 on the math portion of the SAT test. What would be the z-score cut off for this score? A. 1.0 B. -1.0 C. 0 D. 2.0arrow_forwardSee pictures for question D and E and (A, B and Cand was submitted on a different question. According to a report done by S & J Power, the mean lifetime of the light bulbs it manufactures is 44 months. A researcher for a consumer advocate group tests this by selecting 16 bulbs at random. For the bulbs in the sample, the mean lifetime is 47 months. It is known that the population standard deviation of the lifetimes is 5 months. Assume that the population is normally distributed. Can we conclude, at the 0.10 level of significance, that the population mean lifetime, μ, of light bulbs made by this manufacturer differs from 44 months? Perform a two-tailed test. Then complete the parts below. Carry your intermediate computations to three or more decimal places, and round your responses as specified below.arrow_forward
- In the past, the mean age of consumers of a product was 38 years. Recently the product has been drastically changed. In order to determine whether there has been a change in the mean age of the product consumers, a sample of 16 consumers is selected. The mean age in the sample is 33 years and the standard deviation in the sample is 10 years. Let u = the mean age of the current product (Problem Set #7) consumers. The value of the test statistic is Oa. -2.00 O b.-1.60 OC .0.8 O d. 4.21arrow_forwardA population has a mean μ = 82 and a standard deviation o = 16. Find the mean and standard deviation of a sampling distribution of sample means with sample size n = 64. H = (Simplify your answer.) ...arrow_forwardUse the formula to find the standard error of the distribution of differences in sample means, ₁ - ₂. Samples of size 35 from Population 1 with mean 3.1 and standard deviation 1.8 and samples of size 35 from Population 2 with mean 2.0 and standard deviation 1.4 Round your answer for the standard error to two decimal places. standard error = iarrow_forward
- The output below is for a t-test for the hypothesis: Individuals living in bad neighborhoods commit more crime than those living in good neighborhoods. The data in the Group Statistics section provides you with the average number of crimes committed by individuals living in good and bad neighborhoods and the standard deviation of this same variable. The findings of significance are located in the Independent Samples Test section. Pay particular attention to the "t" column and the "Sig (2-tailed)"column. The "t" column is the t value that you would have calculated by hand (as we learned in class). The "Sig (2-tailed)"column provides you with the p value (the level of significance of this relationship). In this column, any value below .05 indicates that you would have rejected your null hypothesis. 1. Can someone tell me about the relationship of all these data? I'm trying to determine if my hypothesis, listed below, can be proven or disproven? 2. What is the independent variable and…arrow_forwardI am having trouble how to solve these...arrow_forwardFor the following situation, find the mean and standard deviation of the population. List all samples (with replacement) of the given size from that population and find the mean of each. Find the mean and standard deviation of the sampling distribution and compare them with the mean and standard deviation of the population. The scores of three students in a study group on a test are 94, 93, 97. Use a sample size of 3. The mean of the population is (Round to two decimal places as needed.) Carrow_forward
- Use the following information for questions 3 and 4. A study of class lengths at two schools was done using independent samples. 31 classes were chosen from each. The first school had a mean length of 50.1 minutes and a standard deviation of 1.6 minutes. The second school had a mean length of 48.9 and a standard deviation of 2.2 minutes. We want to determine at α = 0.01 if the means are different. Assume all test conditions are satisfied. What are the null and alternate hypotheses (write in equation/inequality form)?arrow_forwardYou are given the following information: sample mean is equal to 103.55, population standard deviation is equal to 14.88, sample size is equal to 111 and the national average is equal to 109. What would be the value of z-observed?arrow_forward
arrow_back_ios
arrow_forward_ios
Recommended textbooks for you
- MATLAB: An Introduction with ApplicationsStatisticsISBN:9781119256830Author:Amos GilatPublisher:John Wiley & Sons Inc
 Probability and Statistics for Engineering and th...StatisticsISBN:9781305251809Author:Jay L. DevorePublisher:Cengage Learning
 Statistics for The Behavioral Sciences (MindTap C...StatisticsISBN:9781305504912Author:Frederick J Gravetter, Larry B. WallnauPublisher:Cengage Learning
  Elementary Statistics: Picturing the World (7th E...StatisticsISBN:9780134683416Author:Ron Larson, Betsy FarberPublisher:PEARSON
 The Basic Practice of StatisticsStatisticsISBN:9781319042578Author:David S. Moore, William I. Notz, Michael A. FlignerPublisher:W. H. Freeman
 Introduction to the Practice of StatisticsStatisticsISBN:9781319013387Author:David S. Moore, George P. McCabe, Bruce A. CraigPublisher:W. H. Freeman
MATLAB: An Introduction with Applications
Statistics
ISBN:9781119256830
Author:Amos Gilat
Publisher:John Wiley & Sons Inc
Probability and Statistics for Engineering and th...
Statistics
ISBN:9781305251809
Author:Jay L. Devore
Publisher:Cengage Learning
Statistics for The Behavioral Sciences (MindTap C...
Statistics
ISBN:9781305504912
Author:Frederick J Gravetter, Larry B. Wallnau
Publisher:Cengage Learning
Elementary Statistics: Picturing the World (7th E...
Statistics
ISBN:9780134683416
Author:Ron Larson, Betsy Farber
Publisher:PEARSON
The Basic Practice of Statistics
Statistics
ISBN:9781319042578
Author:David S. Moore, William I. Notz, Michael A. Fligner
Publisher:W. H. Freeman
Introduction to the Practice of Statistics
Statistics
ISBN:9781319013387
Author:David S. Moore, George P. McCabe, Bruce A. Craig
Publisher:W. H. Freeman