MATLAB: An Introduction with Applications
6th Edition
ISBN: 9781119256830
Author: Amos Gilat
Publisher: John Wiley & Sons Inc
expand_more
expand_more
format_list_bulleted
Question

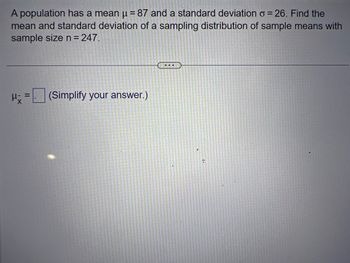
Transcribed Image Text:A population has a mean μ = 87 and a standard deviation o = 26. Find the
mean and standard deviation of a sampling distribution of sample means with
sample size n = 247.
H x =
(Simplify your answer.)
...
R
Expert Solution
This question has been solved!
Explore an expertly crafted, step-by-step solution for a thorough understanding of key concepts.
Step by stepSolved in 3 steps with 7 images

Knowledge Booster
Similar questions
- Given population parameters for two populations, population 1 has a mean of 500 and a standard deviation equal to 40. Population 2 has a mean of 28,000 and a standard deviation equal to 5,000. Complete parts a and b below. a) Compute the coefficient of variation for each population. The coefficient of variation of population 1 is %. (Round to one decimal place as needed.) %. The coefficient of variation of population 2 is (Round to one decimal place as needed.) b) Which population has data values that are more variable relative to the size of their population mean? A. Population 1 B. Both populations are equally variable relative to their population means. OC. Population 2arrow_forwardA survey was taken in a college class asking how many people lived in each student's household, with the sample data collected as numbers of people and frequencies. The data collected is given in the table below. Number of People (x) Number of Respondents in Survey (f) 1 3 2 6 3 16 4 4 Calculate the standard deviation of the above sample table of frequencies: Round your answer to 2 decimal places and be sure to use the correct formula.arrow_forwardQ1. Find mean, Variance and standard deviation for the distribution X 5 6 7 8 9 10 0.1 0.15 0.1 P(X): 0.05 0.2 0.4arrow_forward
- For a sample with a standard deviation of s = 12, a score of X = 42 corresponds to z = –0.50. The mean for the sample is M = ___. a. 48 b. 45 c. 40 d. 36arrow_forwardPlease answer a,b,carrow_forwardSuppose a variable x has population mean μ - 39.45 and standard deviation o = = 2.67. Determine the standard error (SE) of the sampling distribution of the mean of a simple random sample of size n = 12. Give your answer precise to two decimal places. Answer: Checkarrow_forward
- A population has a mean μ = 72 and a standard deviation a=27. Find the mean and standard deviation of a sampling distribution of sample means with sample size H n=81. IIE R (Simplify your answer.) (Simplify your answer.) a: =arrow_forwarddescribe the sampling distribution of the sample proportion providing an example not essay not assignment it's short answer 100-150 words with the exaplearrow_forwardWhich of the following formulas is used to calculate the standard deviation of the sampling distribution of the sample mean (for infinite population) when the population standard deviation is given? A. 0g N-n C. Oz= N-n %3D VN-1 Vn+1 V N-1 B. 0 D. Og = 5.arrow_forward
- Calculate both the sample and the population standard deviations using the data below. X 13 27 17 11 21 18 Please show the following answers to 1 decimal place. Sample Standard Deviation (s) = %3D Population Standard Deviation (o) = %3D Notice the different!arrow_forwardUse the information below to answer Questions #28 and #29. A population has a mean u = 86 and a standard deviation o = 6. Find the population mean of the sample means (HE) with sample size n = 36. Simplify your answer.arrow_forwardThe number of years of education of self‑employed individuals in the United States has a population mean of 13.6 years and a population standard deviation of 3 years. If we survey a random sample of 100 self‑employed people to determine the average number of years of education for the sample, what is the standard deviation of the sampling distribution of ?¯x¯ , the sample mean? 13.6 years 0.3 years 3 yearsarrow_forward
arrow_back_ios
SEE MORE QUESTIONS
arrow_forward_ios
Recommended textbooks for you
 MATLAB: An Introduction with ApplicationsStatisticsISBN:9781119256830Author:Amos GilatPublisher:John Wiley & Sons Inc
 Probability and Statistics for Engineering and th...StatisticsISBN:9781305251809Author:Jay L. DevorePublisher:Cengage Learning
 Statistics for The Behavioral Sciences (MindTap C...StatisticsISBN:9781305504912Author:Frederick J Gravetter, Larry B. WallnauPublisher:Cengage Learning
 Elementary Statistics: Picturing the World (7th E...StatisticsISBN:9780134683416Author:Ron Larson, Betsy FarberPublisher:PEARSON
 The Basic Practice of StatisticsStatisticsISBN:9781319042578Author:David S. Moore, William I. Notz, Michael A. FlignerPublisher:W. H. Freeman
 Introduction to the Practice of StatisticsStatisticsISBN:9781319013387Author:David S. Moore, George P. McCabe, Bruce A. CraigPublisher:W. H. Freeman

MATLAB: An Introduction with Applications
Statistics
ISBN:9781119256830
Author:Amos Gilat
Publisher:John Wiley & Sons Inc

Probability and Statistics for Engineering and th...
Statistics
ISBN:9781305251809
Author:Jay L. Devore
Publisher:Cengage Learning

Statistics for The Behavioral Sciences (MindTap C...
Statistics
ISBN:9781305504912
Author:Frederick J Gravetter, Larry B. Wallnau
Publisher:Cengage Learning

Elementary Statistics: Picturing the World (7th E...
Statistics
ISBN:9780134683416
Author:Ron Larson, Betsy Farber
Publisher:PEARSON

The Basic Practice of Statistics
Statistics
ISBN:9781319042578
Author:David S. Moore, William I. Notz, Michael A. Fligner
Publisher:W. H. Freeman

Introduction to the Practice of Statistics
Statistics
ISBN:9781319013387
Author:David S. Moore, George P. McCabe, Bruce A. Craig
Publisher:W. H. Freeman