
ENGR.ECONOMIC ANALYSIS
14th Edition
ISBN: 9780190931919
Author: NEWNAN
Publisher: Oxford University Press
expand_more
expand_more
format_list_bulleted
Related questions
Question
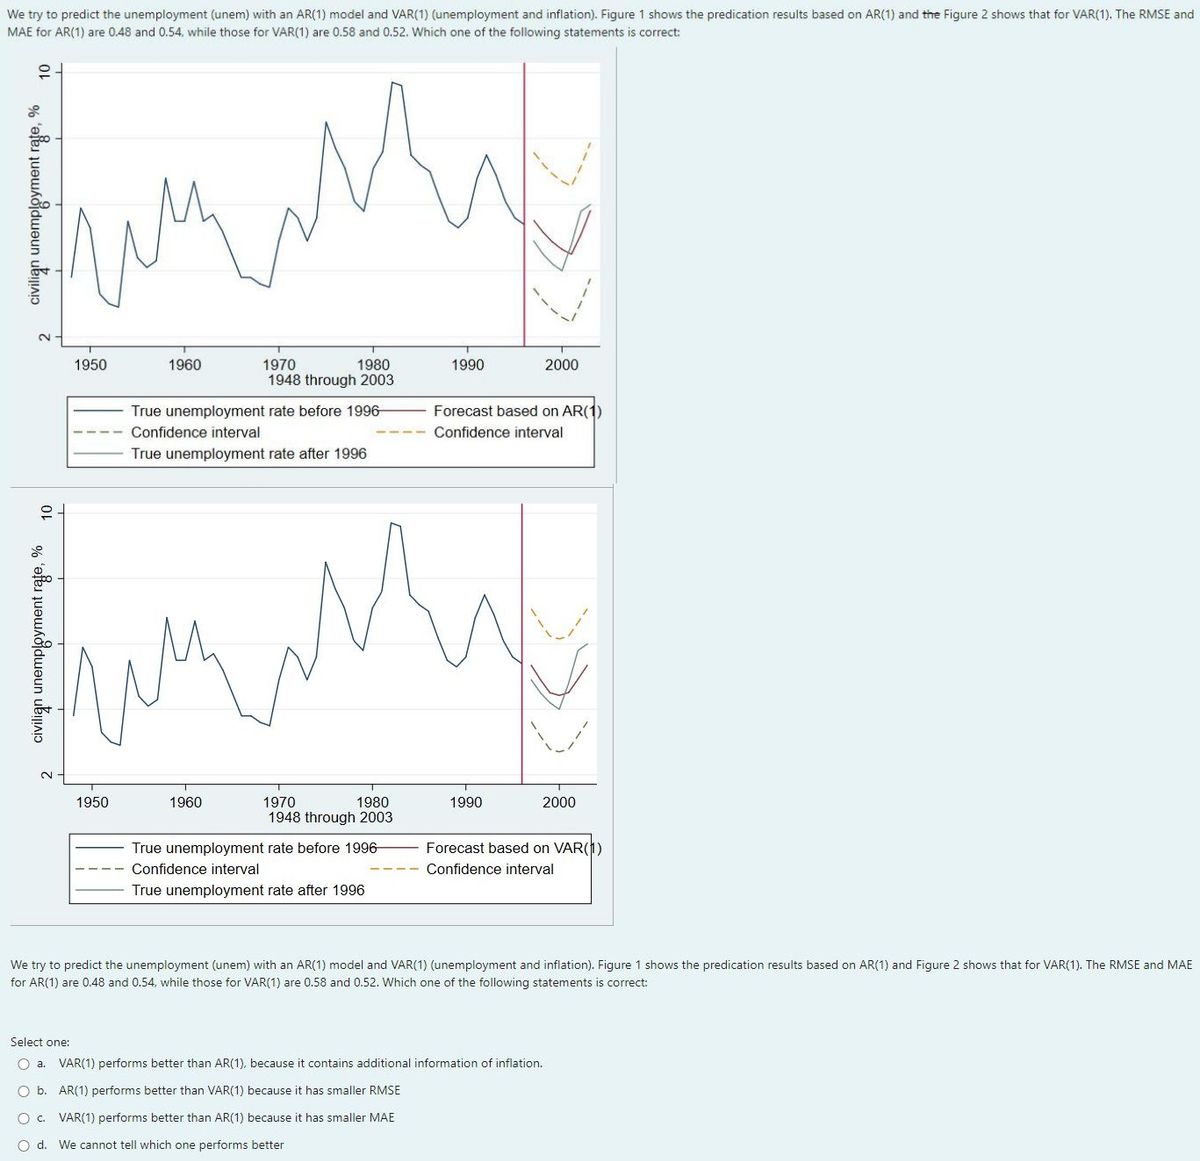

Transcribed Image Text:We try to predict the unemployment (unem) with an AR(1) model and VAR(1) (unemployment and inflation). Figure 1 shows the predication results based on AR(1) and the Figure 2 shows that for VAR(1). The RMSE and
MAE for AR(1) are 0.48 and 0.54, while those for VAR(1) are 0.58 and 0.52. Which one of the following statements is correct:
10
civilian unemployment rate, %
амми
um
1950
O b.
O c.
O d.
1960
1950
num
True unemployment rate before 1996
Confidence interval
True unemployment rate after 1996
1970
1980
1948 through 2003
1960
1970
1980
1948 through 2003
True unemployment rate before 1996-
Confidence interval
True unemployment rate after 1996
1990
AR(1) performs better than VAR(1) because it has smaller RMSE
VAR(1) performs better than AR(1) because it has smaller MAE
We cannot tell which one performs better
Forecast based on AR(1)
Confidence interval
1990
2000
2000
We try to predict the unemployment (unem) with an AR(1) model and VAR(1) (unemployment and inflation). Figure 1 shows the predication results based on AR(1) and Figure 2 shows that for VAR(1). The RMSE and MAE
for AR(1) are 0.48 and 0.54, while those for VAR(1) are 0.58 and 0.52. Which one of the following statements is correct:
Select one:
O a. VAR(1) performs better than AR(1), because it contains additional information of inflation.
Forecast based on VAR(1)
Confidence interval
Expert Solution
This question has been solved!
Explore an expertly crafted, step-by-step solution for a thorough understanding of key concepts.

This is a popular solution

Trending nowThis is a popular solution!

Step by stepSolved in 2 steps

Knowledge Booster


Learn more about
Need a deep-dive on the concept behind this application? Look no further. Learn more about this topic, economics and related others by exploring similar questions and additional content below.Similar questions
- Draw and properly label an AD-AS model to show Keynesian, intermediate, andneoclassical zones (6%). Then, briefly explain the levels of unemployment, inflationand real GDP in each zone, and also confirm whether all three goals of a macroeconomy are being achieved in each zone. (14%)arrow_forwardCountry A has a population of 250 million. All of the citizens are over the age of 18. Moreover, 100 million citizens go to college and choose not to work. 20 million citizens are looking for jobs, but they cannot find one. The rest are employed. Which of the following statements is true? Choice 1 of 4:The Labor Force participation rate and the unemployment rate are equalChoice 2 of 4:None of these choices are trueChoice 3 of 4:The Labor Force participation rate is lower than the unemployment rateChoice 4 of 4:The Employment rate is 42%arrow_forwardConsider the model of unemployment with job separation rate s = 0.05 and job finding rate f = 0.20. If the unemployment rate U = 10,000, L = 200,000, and E = 190,000 then what will the natural rate of unemployment be? Please show your calculation. If U were to fall to 5,000 because of an exogenous shock, how would the unemployment rate change in the short run? In the long run? If s were to fall to 0.03 because of an exogenous shock, how would the unemployment rate change in the short run? In the long run?arrow_forward
- Please no written by hand solutionsarrow_forward== Assume that Co = 40, G = 220, T = 120, I = 150, X = 44, Z = M = 54, b = mpc = .75 and t =.25, the actual unemployment rate = 5.7%, and the natural unemployment rate is 5.1%. A one dollar increase in G will cause Y to increase by dollars. $2.439 $2.392 $2.305 $2.286 $2.253arrow_forwardThe equation of the Phillips curve from 1970 to 1995 is: -17.4-1.2u₁. The natural rate of unemployment using this curve is 6.2%. (round your answer to one decimal place) The equation of the Phillips curve from 1996 to 2018 is: x=2.8% -0.16+ Which of the following explains why the natural rate of unemployment cannot immediately be calculated from the Philips curve? A. The expression only provides Ⓡ and a. B. The equation does not include a specific value for expected inflation. C. The expression only provides (m + z) and . D. None of the above. Using the line drawing tool, accurately graph the Phillips relation=2.8% -0.16 with inflation on the vertical axis and unemployment on the horizontal axis. Carefully follow the instructions above and only draw the required object. What is the natural rate of unemployment using the relation = 2.8% -0.16u, under the assumption that the value of x=2% The natural rate of unemployment fell to 5% between 1970-1995 and 1996-2018? (round your answer to…arrow_forward
- In response to the covid-19 pandemic, many governments responded by an economic stimulus package to mitigate the negative impact of the pandemic on affected families. Changes in economic policies will frequently have an impact on the unemployment rate. Explain whether each of the policy changes described is likely to: (1) affect frictional or structural unemployment and (2) increase or decrease the measured unemployment rate.a) An increase in the number of weeks of employment insurance that unemployed workerscan receive. b) An increase in the minimum wage rate a) The government introduced new job-training programs to help people who lost their jobs in the affected sectors switch to other sectors.arrow_forwardThe Phillips curve in Lowland takes the form of π = 0.04 – 0.5 (u – 0.05), where π is the actual inflation rate and u is the unemployment rate. The Phillips curve in Highland takes the form of π = 0.08 – 0.5 (u – 0.05). The current unemployment rate in both countries is 9 percent (0.09). Explain the similarities in the Phillips curves in Highland and in Lowland.arrow_forwardUse an appropriate graphical framework to illustrate the effects of the following supply-side factors on unemployment: (i) (ii) An increase in marginal tax rates A fall in unemployment benefit, decreasing the replacement rate.arrow_forward
- Consider an economy with a natural unemployment rate, u, of 7%. The expectations-augmented Phillips curve is: 1= - 0.5(u -ū) Assume that Okun's Law holds so that a 1 percentage point increase in the unemployment rate maintained for one year reduces GDP by 2% of full employment output. Note: Okun's Law can be expressed as: *--2(u-ü) What is the long-run Phillips curve: OA. Inflation rate 8- OB. OC. O D. none of the answers is correct Inflation rate Inflation rate 6- 6- 6-arrow_forwardPhelps was suspicious of the tradeoff suggested by the Phillips curve. He thought that sensible, forward-looking people should not change their behavior just because the prices on all the price tags in the economy increased at 4% per year instead of at 2% per year. Phelps started his analysis by asking what determines the unemployment rate. One of the key points he recognized was that unemployment is the inevitable consequence of an economy in which some firms go out of business each month and some workers quit their jobs each month. Once a worker is out of a job, the individual will take some time searching for the next one. Consider the following scenario. Picture an economy with 100,000 workers in its labor force. The unemployment rate is simply the number of unemployed workers divided by the number of workers in the labor force. At the beginning of January, the unemployment rate is 4.76%, so 4,760 people in the labor force are unemployed. Suppose that in January, 10% of the workers…arrow_forwardJapan is experiencing Inflation due to excess demand. Draw a correctly labled AS/AD model representing where the economy is relative to the Natural Rate of Unemploymentarrow_forward
arrow_back_ios
SEE MORE QUESTIONS
arrow_forward_ios
Recommended textbooks for you
 Principles of Economics (12th Edition)EconomicsISBN:9780134078779Author:Karl E. Case, Ray C. Fair, Sharon E. OsterPublisher:PEARSON
 Engineering Economy (17th Edition)EconomicsISBN:9780134870069Author:William G. Sullivan, Elin M. Wicks, C. Patrick KoellingPublisher:PEARSON
 Principles of Economics (MindTap Course List)EconomicsISBN:9781305585126Author:N. Gregory MankiwPublisher:Cengage Learning
 Managerial Economics: A Problem Solving ApproachEconomicsISBN:9781337106665Author:Luke M. Froeb, Brian T. McCann, Michael R. Ward, Mike ShorPublisher:Cengage Learning
 Managerial Economics & Business Strategy (Mcgraw-...EconomicsISBN:9781259290619Author:Michael Baye, Jeff PrincePublisher:McGraw-Hill Education
Principles of Economics (12th Edition)
Economics
ISBN:9780134078779
Author:Karl E. Case, Ray C. Fair, Sharon E. Oster
Publisher:PEARSON
Engineering Economy (17th Edition)
Economics
ISBN:9780134870069
Author:William G. Sullivan, Elin M. Wicks, C. Patrick Koelling
Publisher:PEARSON
Principles of Economics (MindTap Course List)
Economics
ISBN:9781305585126
Author:N. Gregory Mankiw
Publisher:Cengage Learning
Managerial Economics: A Problem Solving Approach
Economics
ISBN:9781337106665
Author:Luke M. Froeb, Brian T. McCann, Michael R. Ward, Mike Shor
Publisher:Cengage Learning
Managerial Economics & Business Strategy (Mcgraw-...
Economics
ISBN:9781259290619
Author:Michael Baye, Jeff Prince
Publisher:McGraw-Hill Education