
ENGR.ECONOMIC ANALYSIS
14th Edition
ISBN: 9780190931919
Author: NEWNAN
Publisher: Oxford University Press
expand_more
expand_more
format_list_bulleted
Related questions
Question
- Calculate and interpret the Coefficient of Correlation between the following indicators:
GDP (Current $US) and Goods exports (BoP, current US$)
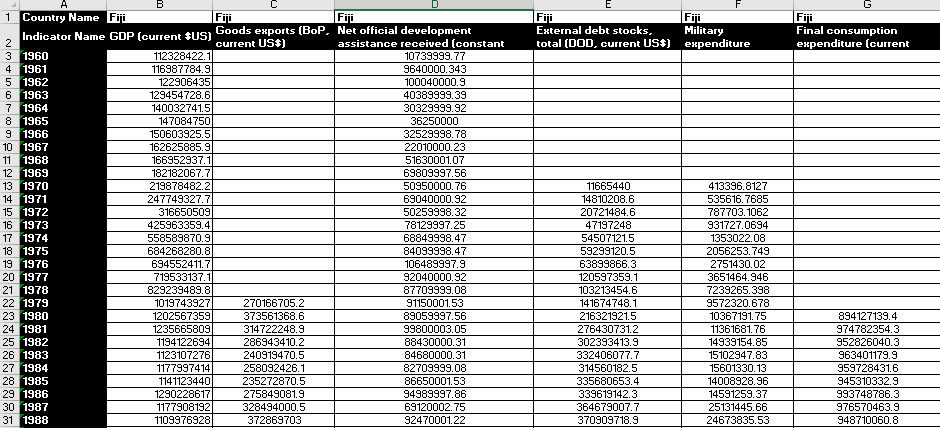

Transcribed Image Text:1 Country Name Fiji
2
Indicator Name GDP (current $US)
112328422.1
3 1960
4 1961
116987784.9
5 1962
122906435
6 1963
7 1964
8 1965
9 1966
10 1967
11 1968
12 1969
13 1970
14 1971
15 1972
16 1973
17 1974
18 1975
19 1976
20 1977
21 1978
22 1979
23 1980
24 1981
25 1982
26 1983
27 1984
28 1985
29 1986
30 1987
31 1988
129454728.6
140032741.5
147084750
150603925.5
162625885.9
166952937.1
182182067.7
219878482.2
247749327.7
316650509
425963359.4
558589870.9
684268280.8
694552411.7
719533137.1
829239489.8
1019743927
1202567359
1235665809
1194122694
1123107276
1177997414
1141123440
1290228617
1177908192
1109976928
D
Fiji
Fiji
Goods exports (BoP, Net official development
current US$)
270166705.2
373561368.6
314722248.9
286943410.2
240919470.5
258092426.1
235272870.5
275849081.9
328494000.5
372869703
assistance received (constant
10739999.77
9640000.343
100040000.9
40389999.39
30329999.92
36250000
32529998.78
22010000.23
51630001.07
69809997.56
50950000.76
69040000.92
50259998.32
78129997.25
68849998.47
84099998.47
106489997.9
92040000.92
87709999.08
91150001.53
89059997.56
99800003.05
88430000.31
84680000.31
82709999.08
86650001.53
94989997.86
69120002.75
92470001.22
Fiji
External debt stocks,
total (DOD, current US$)
11665440
14810208.6
20721484.6
47197248
54507121.5
59299120.5
63899866.3
120597359.1
103213454.6
141674748.1
216321921.5
276430731.2
302393413.9
332406077.7
314560182.5
335680653.4
339619142.3
364679007.7
370909718.9
Fiji
Military
expenditure
413396.8127
535616.7685
787703.1062
931727.0694
1353022.08
2056253.749
2751430.02
3651464.946
7239265.398
9572320.678
10367191.75
11361681.76
14939154.85
15102947.83
15601330.13
14008928.96
14591259.37
25131445.66
24673835.53
G
Fiji
Final consumption
expenditure (current
894127139.4
974782354.3
952826040.3
963401179.9
959728431.6
945310332.9
993748786.3
976570463.9
948710060.8

Transcribed Image Text:32 1989
33 1990
34 1991
35 1992
36 1993
37 1994
38 1995
39 1996
40 1997
41 1998
42 1999
43 2000
44 2001
45 2002
46 2003
47 2004
48 2005
49 2006
50 2007
51 2008
52 2009
53 2010
54 2011
55 2012
56 2013
57 2014
58 2015
59 2016
60 2017
61 2018
62 2019
63 2020
1182686577
1337024782
1383843860
1532401863
1636074718
1825763268
1970347721
2128696644
2090184941
1653160862
1936484565
1678239218
1652464201
1833279985
2300453634
2708078477
2980484920
3076305453
3378314600
3523185920
2870624636
3140181444
3779378134
3972012571
4189915667
4857220602
4682546881
4930204220
5353404419
5581371848
5481675173
4477040340
377123595.5
415555768.1
362574823.4
349769265.6
370936096.4
490190386.7
519649206
672201239.9
535646873.4
428927346.1
537716570.4
530125262.7
496959366.8
464124766.1
651015610.4
634301946.2
680569041.2
659151820.7
722647098.9
901997972.2
615098781.7
819747577.5
1071737361
1205131844
1143327159
1208532271
970193385.8
921839857.5
987051789.2
1003626840
1026264878
819285988.1
70610000.61
81319999.69
71519996.64
98709999.08
89629997,25
57450000.76
57750000
59569999.69
61150001.53
54919998.17
47950000.76
42349998.47
41250000
49729999.54
65269996.64
78339996.34
77809997.56
66940002.44
54150001.53
46389999.39
66319999.69
69809997.56
61450000.76
87389999.39
80459999.08
85569999.69
109470001.2
123989997.9
148990005.5
120959999.1
142860000.6
316399872
318026329.3
282093980.4
257427622.5
246248945.3
196861157.8
183417026
165771501
158130798.8
140365632.2
203848126.2
194527935.4
181389690.1
211378367.3
258131310.3
263742090.4
302666509.7
373224464.8
397932776.2
689116436.7
1067927269
1107442022
1355509518
1270343618
1284885601
1291245045
1232759435
1297960843
1267715374
1245387658
1344060627
1518014489
29083211.42
30542031.59
32482582.88
30539125.34
32041095.62
33665273.34
34700248.16
32851136.61
30962540.18
22598926.93
23811699.72
32039537.35
32811655.82
30914304.27
37296898.08
46798811.28
43111350.29
54067168.06
75576918.3
53585658.62
51285722.32
50408953.71
60785527.47
59221516.41
58108276.9
74787941.13
42617557.6
54411608
75276555.01
81378313.57
79497171.86
73510781.83
1063567721
1208124114
1241365546
1326246174
1358953172
1456160781
1580830548
1586973562
1582046131
1182252869
1277467506
1249412760
1210225775
1283231972
1568519886
1764512406
2768866884
2919347967
3034012793
3287996737
2652227233
2741880154
3205195182
3407651880
3560302704
3786928102
3621853547
3960758104
4288693212
4512216154
4475513794
3789452693
Expert Solution
This question has been solved!
Explore an expertly crafted, step-by-step solution for a thorough understanding of key concepts.

This is a popular solution

Trending nowThis is a popular solution!

Step by stepSolved in 2 steps with 4 images

Knowledge Booster


Learn more about
Need a deep-dive on the concept behind this application? Look no further. Learn more about this topic, economics and related others by exploring similar questions and additional content below.Similar questions
- Gross domestic product (GDP) is a measurement of the total value of all goods and services produced in the United States over a given time period. It is used by economists, government officials, market forecasters and others to gauge the overall health of the U.S. economy. How do consumers drive the nation's GDP?arrow_forwardFind the value of exports if net exports is $310 million and imports are $130 millionarrow_forwardGDP is often calculated using the expenditures approach, where you add up all spending in four categories: Consumption (C) + Business Investment (I) + Government Spending (G) + Net Exports (Xn). Based on the data you viewed, you can assume that due to the COVID-19 pandemic, the US GDP took the largest hit from which of the expenditure categories? -Consumption -Business Investment Government -Spending -Net Exportsarrow_forward
- The gross domestic product (GDP) of the United States is defined as the all in a given period of time. Based on this definition, indicate which of the following transactions will be included in (that is, directly increase) the GDP of the United States in 2023. 2023 GDP Scenario Included Excluded Gamewear, a U.S. electronics company, produces a VR headset at a plant in South Korea on March 11, 2023. Gamewear imports the VR headset into the United States on May 29, 2023. Ο Rotato, a U.S. tire company, produces a set of tires at a plant in Michigan on September 25, 2023. It sells the set of tires to Speedmaster for use in the production of a two-door coupe that will be made in the United States in 2023. (Note: Focus exclusively on whether production of the set of tires increases GDP directly, and ignore the effect of production of the two-door coupe on GDP.) Larry's Lattes, a U.S. coffee company, produces a latte at its location in Los Angeles on January 6, 2023. It sells the latte to a…arrow_forwardAn Indian citizen living in the US builds a new house in Spokane. In GDP calculations, this would be counted under: Group of answer choices 1) Imports 2) Consumption 3) Government Spending 4) Exports 5) Investmentarrow_forwardExplain the initial effect of each of the following events on Canada’s GDP. a) Toby sells his used car to Maria. b) The value of your Home Depot stock holdings decrease. c) You use $100,000 to buy a piece of land with the intention of building a new house on it. d) Sharon buys a new pair of jeans at a department store in another town in her province. e) An Irish tourist drinks an American beer in a Canadian restaurant. f) Your local car dealership reduces its inventory by offering price reductions. g) You sell all the shares in your Canadian National Railway Company holdings. h) Jermaine travels with Air Canada to Grenada and buys rum and spices. i) Bickram gets a haircut and beard trimmed at his local barbershop. j) Katherine, a retired worker, gets an increase in her Canada Pension Plan benefits.arrow_forward
- When examining GDP on a global scale, two issues become apparent. Is it conceivable to take these factors into account when comparing GDPs, and what exactly are these factors?arrow_forwardPlease provide answer in 1 hr pleasearrow_forwardThe country of Sylvania produces and consumes only three goods: Red Bull, pizza, and T-shirts. The quantity produced and price of each good in 2011 and 2012 are given in the following table: 2011 2012 T-Shirts Red Bull (cans) Pizza (slices) Quantity 100 530 970 Price $25 $1 $3 Quantity 120 530 890 Price $25 $2 56 Nominal GDP in 2011 was $ and nominal GDP in 2012 was $ (Enter your responses as integers.) If 2011 is the base year, real GDP in 2011 was $ and real GDP in 2012 was $ (Enter your responses as integers.) Based on your answer above, the percentage change in real GDP between 2011 and 2012 was percent. (Round your response to two decimal places and use a minus sign if necessary.) If 2012 is the base year, real GDP in 2011 was $ and real GDP in 2012 was $ (Enter your responses as integers.) Based on your answer above, the percentage change in real GDP between 2011 and 2012 was Using 2011 as the base year, the GDP deflator in 2011 was and the GDP deflator in 2012 was Based on your…arrow_forward
- Q25arrow_forwardSuppose you are given the following data for a particular economy (unit: Millions of Euros):Gross National Income mp (GNImp) =1650Investment (I) = 220(Iliq) Net investment = 210Private consumption(C) =1100Net External Income (NEI) = 0Net Indirect Taxes (NIT) = 231Public Spending (G) = 363 Calculate: a) Balance of Goods and Services or Net Exports (NX) and Amortizations/Depreciations (A). b) Net National Product at Base Prices (NNPbp) and Net Domestic Product at Base Prices (NDPbp)arrow_forwardFind the attached file.arrow_forward
arrow_back_ios
SEE MORE QUESTIONS
arrow_forward_ios
Recommended textbooks for you
 Principles of Economics (12th Edition)EconomicsISBN:9780134078779Author:Karl E. Case, Ray C. Fair, Sharon E. OsterPublisher:PEARSON
 Engineering Economy (17th Edition)EconomicsISBN:9780134870069Author:William G. Sullivan, Elin M. Wicks, C. Patrick KoellingPublisher:PEARSON
 Principles of Economics (MindTap Course List)EconomicsISBN:9781305585126Author:N. Gregory MankiwPublisher:Cengage Learning
 Managerial Economics: A Problem Solving ApproachEconomicsISBN:9781337106665Author:Luke M. Froeb, Brian T. McCann, Michael R. Ward, Mike ShorPublisher:Cengage Learning
 Managerial Economics & Business Strategy (Mcgraw-...EconomicsISBN:9781259290619Author:Michael Baye, Jeff PrincePublisher:McGraw-Hill Education
Principles of Economics (12th Edition)
Economics
ISBN:9780134078779
Author:Karl E. Case, Ray C. Fair, Sharon E. Oster
Publisher:PEARSON
Engineering Economy (17th Edition)
Economics
ISBN:9780134870069
Author:William G. Sullivan, Elin M. Wicks, C. Patrick Koelling
Publisher:PEARSON
Principles of Economics (MindTap Course List)
Economics
ISBN:9781305585126
Author:N. Gregory Mankiw
Publisher:Cengage Learning
Managerial Economics: A Problem Solving Approach
Economics
ISBN:9781337106665
Author:Luke M. Froeb, Brian T. McCann, Michael R. Ward, Mike Shor
Publisher:Cengage Learning
Managerial Economics & Business Strategy (Mcgraw-...
Economics
ISBN:9781259290619
Author:Michael Baye, Jeff Prince
Publisher:McGraw-Hill Education