
MATLAB: An Introduction with Applications
6th Edition
ISBN: 9781119256830
Author: Amos Gilat
Publisher: John Wiley & Sons Inc
expand_more
expand_more
format_list_bulleted
Related questions
Question
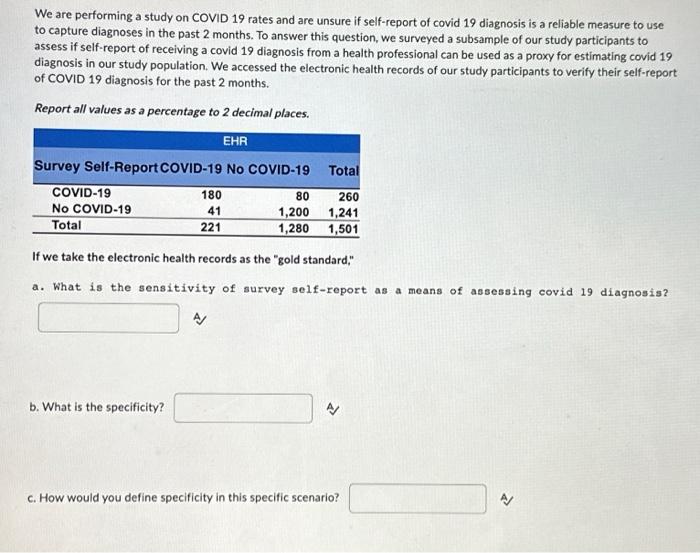

Transcribed Image Text:We are performing a study on COVID 19 rates and are unsure if self-report of covid 19 diagnosis is a reliable measure to use
to capture diagnoses in the past 2 months. To answer this question, we surveyed a subsample of our study participants to
assess if self-report of receiving a covid 19 diagnosis from a health professional can be used as a proxy for estimating covid 19
diagnosis in our study population. We accessed the electronic health records of our study participants to verify their self-report
of COVID 19 diagnosis for the past 2 months.
Report all values as a percentage to 2 decimal places.
EHR
Survey Self-Report COVID-19 No COVID-19
COVID-19
No COVID-19
Total
180
41
221
b. What is the specificity?
Total
80
260
1,200 1,241
1,280 1,501
If we take the electronic health records as the "gold standard,"
a. What is the sensitivity of survey self-report as a means of assessing covid 19 diagnosis?
A/
N
c. How would you define specificity in this specific scenario?
N
Expert Solution
This question has been solved!
Explore an expertly crafted, step-by-step solution for a thorough understanding of key concepts.

Step by stepSolved in 5 steps with 3 images

Knowledge Booster

Similar questions
- A veterinarian wants to perform a study at a local animal shelter where 200 dogs need training on behavior modification. The purpose of the study would be to determine if using a firm voice during training for 10 minutes improves a dog's learning behavior compared to not speaking during training for 10 minutes. Part A: Describe an appropriate design for the study. Part B: The hypotheses for this study are as follows: Ho: There is no difference in the mean improvement of dogs during behavior modification for either treatment. Ha: The mean improvement of dogs during behavior modification is greater for the firm voice treatment. The shelters will allow trainers to use a firm voice during training if the null hypothesis is rejected. What are the possible Type I and II errors? Describe the consequences of each in the context of this study and discuss which type you think is more serious.narrow_forwardA purchasing manager for a large university is investigating which brand of LCD projector to purchase to equip their classrooms. Of major concern is the longevity of the light bulbs used in the projectors. The purchasing manager has narrowed down the choice of projector to two brands, Infocus and Proxima, and wishes to determine if there is any difference between the two brands in the mean lifetime of the bulbs used. The purchasing manager obtained thirteen projectors of each brand for testing over the last several academic terms. The number of hours the bulbs lasted on each of the thirteen projectors is given in the table. Lifetimes of light bulbs (hours) Infocus 830, 867, 1013, 986, 819, 809, 691, 903, 673, 909, 957, 820, 715 Proxima 532, 718, 769, 806, 779, 970, 903, 1043, 947, 792, 841, 752, 689 Send data to calc... v Send data to Excel Assume that the two populations of lifetimes, are normally distributed and that the population variances are equal. Can we conclude, at the 0.01…arrow_forwardWould a descriptive, correlational, independet and dependent variable, quasi-experimental or experiemental, quantitative research design be best for a research question regarding social skills training versus pharmacological treatment?arrow_forward
- Using a sample of 500 adults with the following variables: genhelf - variable recording general self- reported health coded 1 = very good, 2 = good, 3 = fair, 4 = poor sbp - variable recording systolic blood pressure - age - age of the respondent in years sex coded 1 = male and 2 = female hi_sbp - indicator of high blood pressure coded 1 if the respondent's sbp is 130 or higher and 0 otherwise What type of chart is MOST appropriate for the variable sbp? a/ pie chart b/ bar chart c/ histogramarrow_forwardA purchasing manager for a large university is investigating which brand of LCD projector to purchase to equip their classrooms. Of major concern is the longevity of the light bulbs used in the projectors. The purchasing manager has narrowed down the choice of projector to two brands, Infocus and Proxima, and wishes to determine if there is any difference between the two brands in the mean lifetime of the bulbs used. The purchasing manager obtained eight projectors of each brand for testing over the last several academic terms. The number of hours the bulbs lasted on each of the eight projectors is given in the table. Lifetimes of light bulbs (hours) Infocus 745, 955, 1085, 756, 901, 839, 858, 931 Proxima 1012, 988, 957, 920, 878, 1130, 657, 743 Send data to calculator Assume that the two populations of lifetimes are normally distributed and that the population variances are equal. Can we conclude, at the 0.01 level of significance, that u, the mean lifetime of light bulbs in Infocus…arrow_forwardA certain polymer is used for evacuation systems for aircraft. It is important that the polymer be resistant tothe aging process. Fifty specimens of the polymer were used in an experiment. Twenty‐five were assignedrandomly to be exposed to an accelerated batch aging process that involved exposure to high temperatures for10 days. Question Which Treatment results in the higher mean tensile strength? (Circle One) Aging or No AgingWhich Treatment has the higher variability? (Circle One) Aging or No Agingarrow_forward
- The article “Well-Fed Crickets Bowl Maidens Over” (Nature Science Update, February 11, 1999) reported that female field crickets are attracted to males with high chirp rates and hypothesized that chirp rate is related to nutritional status. The usual chirp rate for male field crickets was reported to vary around a mean of 60 chirps per second. To investigate whether the chirp rate was related to nutritional status, investigators fed 22 male crickets a high protein diet for 8 days, after which chirp rate was measured. Let: The parameter μμ be the mean chirp rateof male crickets on a high protein diet for 8 days. Given: The mean chirp rate for the random sample of crickets on the high protein diet was reported to be 65.32 chirps per second with a standard deviation of 12. Research Question: Is there convincing evidence that the mean chirp rate for crickets on a high protein diet implies an advantage in attracting the ladies? It is known that the researchers did not want to…arrow_forwardIs there a relationship between one’s gender and whether one owns a dog, cat, or reptile? Use the data provided in the table below to answer the following question. -Show all the relevant statistical output How do I enter this data in SPSS and which test do I run? I input one column for each level but I am so confused and my output is weird looking. Do I run the One Way ANOVA in order to be able to calculate the effect size? Dog Cat Reptile Row Totals Male 20 17 11 48 Female 25 23 5 53 Column totals 45 40 16 101arrow_forwardNumerous studies have shown that a high fat diet can have a negative effect on a child's health. A new study' suggests that a high fat diet early in life might also have a significant effect on memory and spatial ability. In the double-blind study, young rats were randomly assigned to either a high-fat diet group or to a control group. After 12 weeks on the diets, the rats were given tests of their spatial memory. The article states that "spatial memory was significantly impaired" for the high-fat diet rats, and also tells us that "there were no significant differences in amount of time exploring objects" between the two groups. The p-values for the two tests are 0.0001 and O.7. 'Underwood EL and Thompson LT, "A high-fat diet causes impairment in hippocampal memory and sex-dependent alterations in peripheral metabolism," Neural Plasticity, August 2015. (a) Which p-value goes with the test of spatial memory? 0.0001 0.7arrow_forward
arrow_back_ios
arrow_forward_ios
Recommended textbooks for you
- MATLAB: An Introduction with ApplicationsStatisticsISBN:9781119256830Author:Amos GilatPublisher:John Wiley & Sons Inc
 Probability and Statistics for Engineering and th...StatisticsISBN:9781305251809Author:Jay L. DevorePublisher:Cengage Learning
 Statistics for The Behavioral Sciences (MindTap C...StatisticsISBN:9781305504912Author:Frederick J Gravetter, Larry B. WallnauPublisher:Cengage Learning
  Elementary Statistics: Picturing the World (7th E...StatisticsISBN:9780134683416Author:Ron Larson, Betsy FarberPublisher:PEARSON
 The Basic Practice of StatisticsStatisticsISBN:9781319042578Author:David S. Moore, William I. Notz, Michael A. FlignerPublisher:W. H. Freeman
 Introduction to the Practice of StatisticsStatisticsISBN:9781319013387Author:David S. Moore, George P. McCabe, Bruce A. CraigPublisher:W. H. Freeman
MATLAB: An Introduction with Applications
Statistics
ISBN:9781119256830
Author:Amos Gilat
Publisher:John Wiley & Sons Inc
Probability and Statistics for Engineering and th...
Statistics
ISBN:9781305251809
Author:Jay L. Devore
Publisher:Cengage Learning
Statistics for The Behavioral Sciences (MindTap C...
Statistics
ISBN:9781305504912
Author:Frederick J Gravetter, Larry B. Wallnau
Publisher:Cengage Learning
Elementary Statistics: Picturing the World (7th E...
Statistics
ISBN:9780134683416
Author:Ron Larson, Betsy Farber
Publisher:PEARSON
The Basic Practice of Statistics
Statistics
ISBN:9781319042578
Author:David S. Moore, William I. Notz, Michael A. Fligner
Publisher:W. H. Freeman
Introduction to the Practice of Statistics
Statistics
ISBN:9781319013387
Author:David S. Moore, George P. McCabe, Bruce A. Craig
Publisher:W. H. Freeman