Glencoe Algebra 1, Student Edition, 9780079039897, 0079039898, 2018
18th Edition
ISBN: 9780079039897
Author: Carter
Publisher: McGraw Hill
expand_more
expand_more
format_list_bulleted
Question
A certain polymer is used for evacuation systems for aircraft. It is important that the polymer be resistant to
the aging process. Fifty specimens of the polymer were used in an experiment. Twenty‐five were assigned
randomly to be exposed to an accelerated batch aging process that involved exposure to high temperatures for
10 days.
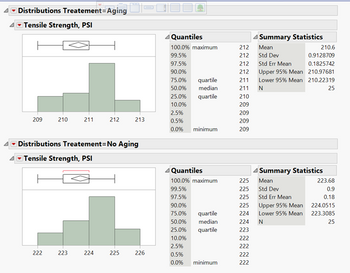
Question Which Treatment results in the higher
Which Treatment has the higher variability? (Circle One) Aging or No Aging

Transcribed Image Text:Distributions Treatement-Aging
Tensile Strength, PSI
209
210
222
211
223
Distributions Treatement-No Aging
Tensile Strength, PSI
1
224
21:
225 226
Quantiles
100.0% maximum
99.5%
97.5%
90.0%
75.0%
quartile
50.0% median
25.0% quartile
10.0%
2.5%
0.5%
0.0%
minimum
Quantiles
100.0% maximum
99.5%
97.5%
90.0%
75.0%
50.0%
25.0%
10.0%
2.5%
0.5%
0.0%
quartile
median
quartile
minimum
212
212
210
209
212
212
211
211 N
209
209
209
225
225
225
Summary Statistics
Mean
Std Dev
Std Err Mean
225
224
224
223
222
222
222
222
210.6
0.9128709
0.1825742
Upper 95% Mean
210.97681
Lower 95% Mean 210.22319
25
Summary Statistics
Mean
Std Dev
Std Err Mean
Upper 95% Mean
Lower 95% Mean
N
223.68
0.9
0.18
224.0515
223.3085
25
Expert Solution
This question has been solved!
Explore an expertly crafted, step-by-step solution for a thorough understanding of key concepts.
Step by stepSolved in 5 steps

Knowledge Booster
Similar questions
- Do the data indicate a significant change in grade distribution? Test at the .05 level of significance. Use Chi-squarearrow_forwardUsing the appropriate model, sample size n, and output below: Model: y = Bo + B₂*₁ + B₂x₂ + B3x3 + Sample size: n=16 Regression Statistics Multiple R R Square Adjusted R Square Standard Error Observations ANOVA Regression Residual Total Total variation Unexplained variation Explained variation R^2 R-bar 2 (1) Report the total variation, unexplained variation, and explained variation as shown on the output. (Round your answers to 4 decimal places.) 0.9981 0.9962 0.9953 381.8582 16 SSE 8^2 DF ss 3 462,380,546.3200 1,749,788.0435 12 15 464,130,334.3635 (2) Report R² and R² as shown on the output. (Round your answers to 4 decimal places.) MS F 154,126,848.7733 1,056.9978 145,815.6703 F(model) (3) Report SSE, ², and s as shown on the output. Calculate s² from SSE and other numbers. (Round your answers to 4 decimal places.) Significance F 0.0000 (4) Calculate the Amodel) statistic by using the explained variation, the unexplained variation, and other relevant quantities. (Round your answer…arrow_forwardnot use ai pleasearrow_forward
- What type of data is the dependent variable in a two sample t-test? Discrete Continuous Qualitative Binaryarrow_forwardThe best depiction of a population characteristic is a(an): Dependent variable Statistic Independent variable Parameterarrow_forwardwe’ve decided to create a survey on the population of pet owners in the Bay Area ranging from younger to older generation individuals. Number of pets owned Frequency Relative Frequency Cumulative Frequency 0 20 20/48=0.4167 20 1 14 14/48=0.29167 34 2 11 11/48=0.2292 45 3 3 3/48=0.0625 48 4 0 0/48=0 5 0 0/48=0 5 or more 0 0/48=0 Summarize your data in a chart with columns showing data value, frequency, relative frequency and cumulative relative frequency. ____Answer the following (rounded to 2 decimal places): 1. ?̅= 2. s = 3. First quartile = 4. Median = 5. 70th percentile = What value is 2 standard deviations above the mean? What value is 1.5 standard deviations below the mean? Construct a histogram displaying your data. In complete sentences, describe the shape of your graph. Do you notice any potential outliers? If…arrow_forward
- Part: 2/4 Part 3 of 4 (c) n=12, p=0.85 Mean: μ 2 Variance: 6 0² = Standard deviation: oarrow_forwardA child care center wants to determine if there is a relationship between how long a child naps in minutes (20,21,22,23,24,etc.,etc) and incidents of aggression (1,2,3,4,etc.,etc). What type of statistical test should be used? Group of answer choices Chi Square Independent t-test Dependent t-test ANOVA Correlation Analysisarrow_forwardCourt_Income Justice_Salary61 27408 431569 901135 58260 45252 62103 25169 2326 24arrow_forward
- A researcher wants to determine if there is a relationship between number of classes students are enrolled in (1,2,3,4,5,etcc.) and stress level scores (measured on a multi-item Likert scale). What type of statistical test should be used? Group of answer choices Correlation Analysis Chi Square Dependent t-test Independent t-test ANOVAarrow_forwardDO MALES AND FEMALES DIFFER ON ATTITUDES TOWARD CRIME ? MALES N=12 FEMALES N=13 CRIME ATTITUDE MALES 77, 97, 28, 55, 75, 43, 21, 70, 91, 22, 58, 45 FEMALES 32,31, 89, 21, 79, 67, 41, 24, 43, 87, 64, 28, 21 MEAN SD MALE FEMALE • DV= 1 •T-VALUE • df • SIGNIFICANT (Y/N). • TEST STATISTIC RAN • ACCEPT OR REJECT NULL HYPOTHESIS. • CONCLUSION:arrow_forwardTable 1: Characteristics of Women According to Intake of Alcohol Variable Nondrinker* Drinker* Test Statistic** P value Mean age of mother at birth (years) 28.2 + 4.4 30.1 + 4.4 19.16 <.0001 % of mothers with education > 12 years 71.1% 77.6% 226.9 <.0001 % of mothers who smoked during pregnancy 7.5% 12.0% 100.7 <.0001 Prepregnancy BMI (kg/m2) 23.8 + 4.6 23.7 + 4.3 0.8 0.469 Write out a complete answer to each of the four research questions stated in the matrix. Be sure to state what is being compared and what group or groups did better and by how much. Also, state if the difference was statistically significant or not. Were the values of BMI more varied among the women who drank or did not drink prior to getting pregnant? Explain how you know this. Upload and submit your completed worksheet assignment. Use Table 1 as your source of information. Use the provided completed cells in the matrix to help you fill in…arrow_forward
arrow_back_ios
SEE MORE QUESTIONS
arrow_forward_ios
Recommended textbooks for you
 Glencoe Algebra 1, Student Edition, 9780079039897...AlgebraISBN:9780079039897Author:CarterPublisher:McGraw Hill

Glencoe Algebra 1, Student Edition, 9780079039897...
Algebra
ISBN:9780079039897
Author:Carter
Publisher:McGraw Hill