A First Course in Probability (10th Edition)
10th Edition
ISBN: 9780134753119
Author: Sheldon Ross
Publisher: PEARSON
expand_more
expand_more
format_list_bulleted
Question

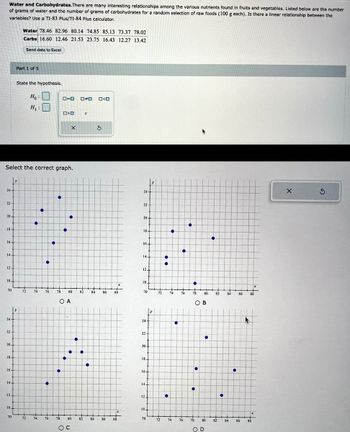
Transcribed Image Text:Water and Carbohydrates. There are many interesting relationships among the various nutrients found in fruits and vegetables. Listed below are the number
of grams of water and the number of grams of carbohydrates for a random selection of raw foods (100 g each). Is there a linear relationship between the
variables? Use a TI-83 Plus/TI-84 Plus calculator.
24-
22-
20.
18+
16-
14-
Select the correct graph.
12
10-
70
24-
22
20
18-
16.
14+
12.
10.
Water 78.46 82.96 80.14 74.85 85.13 73.37 78.02
Carbs 16.60 12.46 21.53 23.75 16.43 12.27 13.42
70
Part 1 of 5
Send data to Excel
State the hypothesis.
Ho:
H₁:
72
72
●
74
74
●
●
76
●
76
●
•
0=0
O>O
●
78
●
78 80
O A
X
●
●
OC
●
D*O
82
●
80 82
P
●
84
O>O
S
86
84 86
X
88
x
88
24+
22
20-
18-
16+
14-
12-
10.
70
24-
22
20-
18.
16+
14
12
10.
70
●
72 74
72
74
●
●
76
76
●
●
78
●
OB
●
78
80
82
80 82
D
●
84
84
86
86
4
88
x
88
X
Ś

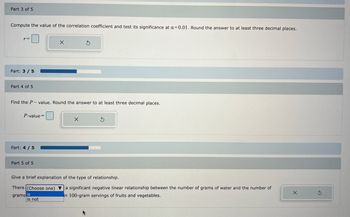
Transcribed Image Text:Part 3 of 5
Compute the value of the correlation coefficient and test its significance at a=0.01. Round the answer to at least three decimal places.
r=
Part: 3/5
Part 4 of 5
P-value=
Find the P-value. Round the answer to at least three decimal places.
Part: 4 / 5
X
Part 5 of 5
S
X
S
Give a brief explanation of the type of relationship.
There (Choose one) a significant negative linear relationship between the number of grams of water and the number of
grams is
in 100-gram servings of fruits and vegetables.
is not
Expert Solution
This question has been solved!
Explore an expertly crafted, step-by-step solution for a thorough understanding of key concepts.
This is a popular solution
Trending nowThis is a popular solution!
Step by stepSolved in 2 steps with 1 images

Knowledge Booster
Similar questions
- File Edit View History Home - myRCC Frequency mylearning.suny.edu/d21/le/content/920969/viewContent/25846458/View -10 8 n= Data was collected for a sample of organic snacks. The amount of sugar (in mg) in each snack is summarized in the histogram below. 6 X 2 Bookmarks Profiles Tab Window Help A.1 HW-23FA STATISTICS (81 X 160 164 168 172 176 180 184 188 amount of sugar (mg) Q What is the sample size for this data set? Submit Question Question Help: Video b Enter your payment details | ba x + BUN SEP 15 MacBook Airarrow_forwardHow strong is this relationship? Obtain the correlation. (Provide your answer to four decimal places.) r=arrow_forwardA sample of blood pressure measurements is taken for a group of adults, and those values (mm Hg) are listed below. The values are matched so that 10 subjects each have a systolic and diastolic measurement. Find the coefficient of variation for each of the two samples; then compare the variation. Systolic 116 130 157 96 158 120 118 137 126 119 Diastolic 81 77 75 53 88 86 58 65 70 84 The coefficient of variation for the systolic measurements is %. (Type an integer or decimal rounded to one decimal place as needed.)arrow_forward
- A data set is summarized in the frequency table below. The data set contains a total of 30 data values. What is the missing frequency? Value Frequency 1 5 2 3 3 4 4 6 5 □ 6 2 7 3 8 4arrow_forwardEach box weighs the same. Which statement is TRUE when comparing the interquartile range (IQR) of the data? 38 32 32 33 29 28 27 26 25 23 Range = Max - Min IQR = Q3-Q1 Brand C Brand Darrow_forwardeat out or in The overall change in the consumer price index is a weighted average of changes in various categories. on november 19, 2011 the boston globe reported the data displayed in figure 5.7. the change in the CPI for food is a weighted average of the change in the cost of food at home and the change in the cost of food away from home. find the weights.arrow_forward
- A sample of blood pressure measurements is taken for a group of adults, and those values (mm Hg) are listed below. The values are matched so that 10 subjects each have a systolic and diastolic measurement. Find the coefficient of variation for each of the two samples; then compare the variation. Systolic 116 130 157 96 158 120 118 137 126 119 Diastolic 81 77 75 53 88 86 58 65 70 84 The coefficient of variation for the systolic measurements is 14.9 %. Type an integer or decimal rounded to one decimal place as needed.) The coefficient of variation for the diastolic measurements is%. Type an integer or decimal rounded to one decimal place as needed.)arrow_forwardA sample of blood pressure measurements is taken for a group of adults, and those values (mm Hg) are listed below. The values are matched so that 10 subjects each have a systolic and diastolic measurement Find the coefficient of variation for each of the two samples; then compare the variation. Systolic 119 127 158 94 156 120 117 137 128 122 e Diastolic 82 74 74 50 89 89 56 62 71 82 The coefficient of variation for the systolic measurements is %. (Type an integer or decimal rounded to one decimal place as needed.) Next Get more help - Next 8:36 PM 50°F Clear 3/27/2022arrow_forwardListed below are pulse rates (beats per minute) from samples of adult males and females. Does there appear to be a difference? Find the coefficient of variation for each of the two samples, then compare the variation. Male 89 70 60 69 68 51 66 55 81 70 60 64 98 54 65 D Female 66 83 80 71 72 86 87 88 90 89 92 72 86 78 79 The coefficient of variation for the male pulse rates is % (Type an integer or decimal rounded to one decimal place as needed.) The coefficient of variation for the female pulse rates is % (Type an integer or decimal rounded to one decimal place as needed.). Compare the variation. The coefficients of variation for each data set are EX Therefore, the male pulse rates vary the female pulse rates.arrow_forward
arrow_back_ios
arrow_forward_ios
Recommended textbooks for you
 A First Course in Probability (10th Edition)ProbabilityISBN:9780134753119Author:Sheldon RossPublisher:PEARSON

A First Course in Probability (10th Edition)
Probability
ISBN:9780134753119
Author:Sheldon Ross
Publisher:PEARSON
