
ENGR.ECONOMIC ANALYSIS
14th Edition
ISBN: 9780190931919
Author: NEWNAN
Publisher: Oxford University Press
expand_more
expand_more
format_list_bulleted
Related questions
Question
1. Using the midpoint method, compute the elasticity between points W and X.
2. Use the midpoint method and compute the elasticity between points W and X.
Select one:
a. Demand between W and X is elastic.
b. Demand between W and X is inelastic.
c. Demand between W and X is unit elastic.
3. Use the midpoint method and compute the elasticity between points X and Y.
Select one:
a. Demand between X and Y is elastic.
b. Demand between X and Y is inelastic.
c. Demand between X and Y is unit elastic.

Transcribed Image Text:### Demand Curve Analysis for Educational Purposes
#### Description of the Diagram
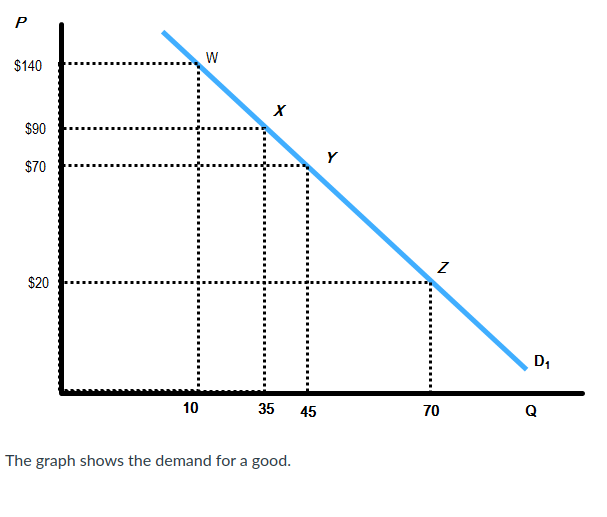
The diagram represents a demand curve for a particular good, labeled as \( D_1 \). This graph demonstrates the relationship between the price of the good (P) on the vertical axis and the quantity demanded (Q) on the horizontal axis.
Key points and lines within the graph are marked with the following coordinates:
- **W**: Price = $140, Quantity = 10 units
- **X**: Price = $90, Quantity = 35 units
- **Y**: Price = $70, Quantity = 45 units
- **Z**: Price = $20, Quantity = 70 units
These points show how changes in price affect the quantity demanded:
- At the highest price point of $140, the quantity demanded is lowest at 10 units (point \( W \)).
- As the price decreases to $90, the quantity demanded increases to 35 units (point \( X \)).
- Further reduction in the price to $70 results in a quantity demanded of 45 units (point \( Y \)).
- At the lowest price of $20, the quantity demanded is highest at 70 units (point \( Z \)).
#### Analysis and Interpretation
The downward sloping demand curve \( D_1 \) illustrates the Law of Demand, which states that, all else being equal, the quantity demanded of a good decreases as the price increases, and conversely, the quantity demanded increases as the price decreases.
By examining the specific points along the curve:
- \( W \): At a higher price ($140), consumers buy less (10 units).
- \( X \): A moderate reduction in price ($90) sees an increase in quantity demanded (35 units).
- \( Y \): A further price drop to $70 increases consumption to 45 units.
- \( Z \): At a significantly lower price ($20), demand peaks at 70 units.
#### Educational Implications
Understanding demand curves is crucial in economics as it helps students analyze consumer behavior, market dynamics, and pricing strategies. By assessing how price changes influence demand, learners can predict market reactions to various pricing policies and understand the economic principles that govern supply and demand interactions.
This particular graph, with its clear visualization and labeled points, serves as an excellent tool for introducing the fundamental concepts of the demand curve, the Law of Demand, and price elasticity.
#### Conclusion
To summarize, the graph
Expert Solution
This question has been solved!
Explore an expertly crafted, step-by-step solution for a thorough understanding of key concepts.

This is a popular solution

Trending nowThis is a popular solution!

Step by stepSolved in 3 steps

Knowledge Booster


Learn more about
Need a deep-dive on the concept behind this application? Look no further. Learn more about this topic, economics and related others by exploring similar questions and additional content below.Similar questions
- Suppose the own price elasticity of demand for good X is -2, its income elasticity is -1, its advertising elasticity is 2, and the cross- price elasticity of demand between it and good Yis-3. Determine how much the consumption of this good will change it Instructions: Enter your responses as percentages. If you are entering a negative number, be sure to use a (-) sign. a. The price of good X decreases by 4 percent. percent b. The price of good Y increases by 10 percent. percent c. Advertising decreases by 3 percent. percent d. Income increases by 2 percent. percentarrow_forwardOn the graph to the right, show the elastic and inelastic portions of a linear demand curve. 1.) Using the double-arrow line drawing tool, show the elastic region of the demand curve by drawing a line segment on top of the portion of the curve that is elastic. Label this line 'Elastic. 2.) Using the double-arrow line drawing tool, show the inelastic region of the demand curve by drawing a line segment on top of the portion of the curve that is inelastic. Label this line 'Inelastic. Carefully follow the instructions above and only draw the required objects. Price per unit ($) 50 45 40 35- 30- 25 20 15- 10- 54 0 0 Demand 10 15 20 25 30 35 40 45 50 Quantity per unit of time Q Q Garrow_forward5. If the price elasticity of demand for a good is 1.5, we would say that its demand is a)inelastic b)elastic c)increasing d)normalarrow_forward
- The price elasticity of demand for Craig's chocolate chip cookies is 1.5. Craig wants to increase his total revenue. Would you recommend that Craig raise or lower his price of chocolate chip cookies? Craig should the price of his chocolate chip cookies because the demand for chocolate chip cookies is A. lower; elastic B. lower; unit elastic C. raise; elastic D. raise; inelastic E. lower; inelasticarrow_forwardcan u solve point d to i d. What is the notation used for this limit value? e. Calculate the limit value. f. Find the point elasticity of demand for p = 1 and determine whether demand is (perfectly) inelastic, is (perfectly) elastic or has unit elasticity. g. Use your answer to question f. to approximate the change in demand when the price of 1 is increased by 0.25%. h. What can you derive from your answer to question f. about the change in revenue when the price is slightly increased starting from p=1? i. Find the price level at which the demand has unit elasticity.arrow_forwardAnswer the following questions in your own words. Start a new thread while replying. 1. What are the determinants of price elasticity of demand? Explain the determinants. 2. What is the difference between inelastic demand and elastic demand? Provide an example of each from real life. 3. Refer to the graph below: Price 22 20 + 18 +- 16 + 14 B 12 10 + 4 Demand +++ 100 200 300 400 500 600 700 800 900 Buaxtity From the graph above calculate: a. Price elasticity of demand from point A to point B (use the mid-point method). Is it an elastic situation or an inelastic situation? b. Price elasticity of demand from point B to point C (use the mid-point method). Is it an elastic situation or an inelastic situation?arrow_forward
- Suppose the own price elasticity of demand for good X is -3, its income elasticity is 1, its advertising elasticity is 2, and the cross-price elasticity of demand between it and good Yis -4. Determine how much the consumption of this good will change if: Instructions: Enter your responses as percentages. If you are entering a negative number, be sure to use a (-) sign. a. The price of good X decreases by 5 percent. percent b. The price of good Yincreases by 10 percent. percent c. Advertising decreases by 3 percent. percent d. Income increases by 4 percent. 4 percentarrow_forwardSuppose the own price elasticity of demand for good X is −2, its income elasticity is 3, its advertising elasticity is 4, and the cross-price elasticity of demand between it and good Y is −6. Determine how much the consumption of this good will change if:Instructions: Enter your responses as percentages. If you are entering a negative number, be sure to use a (−) sign.a. The price of good X decreases by 5 percent. percentb. The price of good Y increases by 10 percent. percentc. Advertising decreases by 2 percent. percentd. Income increases by 3 percent. percentarrow_forwardFor each statement below, tell whether the statement is valid or invalid, and give a short explanation of your answer. Remember that your explanation will be related in some way to elasticity. 1. Coffee and tea should have a positive cross elasticity of demand. 2. Demand for Tide will be more elastic than demand for laundry detergents as a whole. 3. The government will prefer to put excise taxes on jewelry rather than on gasoline.arrow_forward
arrow_back_ios
arrow_forward_ios
Recommended textbooks for you
 Principles of Economics (12th Edition)EconomicsISBN:9780134078779Author:Karl E. Case, Ray C. Fair, Sharon E. OsterPublisher:PEARSON
 Engineering Economy (17th Edition)EconomicsISBN:9780134870069Author:William G. Sullivan, Elin M. Wicks, C. Patrick KoellingPublisher:PEARSON
 Principles of Economics (MindTap Course List)EconomicsISBN:9781305585126Author:N. Gregory MankiwPublisher:Cengage Learning
 Managerial Economics: A Problem Solving ApproachEconomicsISBN:9781337106665Author:Luke M. Froeb, Brian T. McCann, Michael R. Ward, Mike ShorPublisher:Cengage Learning
 Managerial Economics & Business Strategy (Mcgraw-...EconomicsISBN:9781259290619Author:Michael Baye, Jeff PrincePublisher:McGraw-Hill Education
Principles of Economics (12th Edition)
Economics
ISBN:9780134078779
Author:Karl E. Case, Ray C. Fair, Sharon E. Oster
Publisher:PEARSON
Engineering Economy (17th Edition)
Economics
ISBN:9780134870069
Author:William G. Sullivan, Elin M. Wicks, C. Patrick Koelling
Publisher:PEARSON
Principles of Economics (MindTap Course List)
Economics
ISBN:9781305585126
Author:N. Gregory Mankiw
Publisher:Cengage Learning
Managerial Economics: A Problem Solving Approach
Economics
ISBN:9781337106665
Author:Luke M. Froeb, Brian T. McCann, Michael R. Ward, Mike Shor
Publisher:Cengage Learning
Managerial Economics & Business Strategy (Mcgraw-...
Economics
ISBN:9781259290619
Author:Michael Baye, Jeff Prince
Publisher:McGraw-Hill Education