Chemistry
10th Edition
ISBN: 9781305957404
Author: Steven S. Zumdahl, Susan A. Zumdahl, Donald J. DeCoste
Publisher: Cengage Learning
expand_more
expand_more
format_list_bulleted
Concept explainers
Question
thumb_up100%

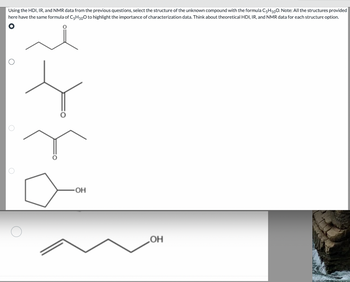
Transcribed Image Text:**Title: Identifying the Structure of an Unknown Compound Using HDI, IR, and NMR Data**
**Instructions:**
Using the HDI, IR, and NMR data from previous questions, select the structure of the unknown compound with the formula C₅H₁₀O. Note: All the structures provided here have the same molecular formula (C₅H₁₀O) to illustrate the significance of characterization data. Consider the theoretical HDI, IR, and NMR data for each structure option.
**Structure Options:**
1. **Structure 1:**
- A linear chain with a ketone group (carbonyl group) on the second carbon.
2. **Structure 2:**
- A branched chain with a ketone group on the second carbon of the main chain.
3. **Structure 3:**
- A linear chain with a ketone group on the third carbon.
4. **Structure 4:**
- A cyclopentane ring with a hydroxyl group attached to one of the carbons.
5. **Structure 5:**
- An unsaturated chain with an alcohol group (OH) at the end and a double bond between the first and second carbon atoms.
**Considerations:**
- **HDI (Hydrogen Deficiency Index):** Indicates the number of pi bonds and rings in a molecule.
- **IR (Infrared Spectroscopy):** Useful for identifying functional groups such as carbonyl (C=O) and hydroxyl (O-H).
- **NMR (Nuclear Magnetic Resonance):** Provides information on the hydrogen and carbon environments, helpful in identifying the framework of the molecule.
**Conclusion:**
Select the structure that best fits the provided data using theoretical knowledge of HDI, IR, and NMR alongside the molecular formula.

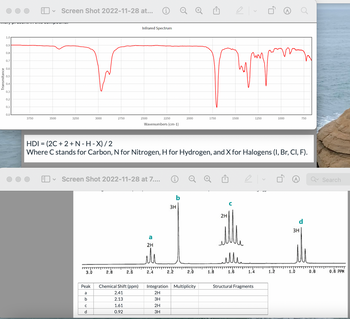
Transcribed Image Text:### Infrared Spectrum Analysis
#### Infrared Spectrum Graph
- **X-Axis (Wavenumbers in cm⁻¹):** Ranges from 3750 to 750 cm⁻¹.
- **Y-Axis (Transmittance):** Ranges from 0 to 1.
- **Description:** The graph shows various peaks indicating absorption at specific wavenumbers. Key absorptions occur around 3000 cm⁻¹, possible indicating the presence of functional groups such as O-H or N-H.
### Hydrogen Deficiency Index (HDI)
- **Formula:** HDI = (2C + 2 + N - H - X) / 2
- **C:** Carbon
- **N:** Nitrogen
- **H:** Hydrogen
- **X:** Halogens (I, Br, Cl, F)
### NMR Spectrum Analysis
#### NMR Spectrum Graph
- **X-Axis (Chemical Shift in ppm):** Ranges from 3.0 to 0.0 ppm.
- **Peaks:**
- **a:** Chemical Shift at 2.41 ppm, Integration = 2H
- **b:** Chemical Shift at 2.13 ppm, Integration = 3H
- **c:** Chemical Shift at 1.61 ppm, Integration = 2H
- **d:** Chemical Shift at 0.92 ppm, Integration = 3H
#### Peak Table
| Peak | Chemical Shift (ppm) | Integration | Multiplicity | Structural Fragments |
|------|----------------------|-------------|--------------|----------------------|
| a | 2.41 | 2H | | |
| b | 2.13 | 3H | | |
| c | 1.61 | 2H | | |
| d | 0.92 | 3H | | |
- **Description:** The NMR spectrum helps identify different hydrogen environments in the molecule, indicating the structure or connectivity of atoms. Each peak corresponds to hydrogen atoms in distinct chemical environments, detailed by their chemical shifts and multiplicity.
Expert Solution
This question has been solved!
Explore an expertly crafted, step-by-step solution for a thorough understanding of key concepts.
This is a popular solution
Trending nowThis is a popular solution!
Step by stepSolved in 3 steps with 2 images

Knowledge Booster
Learn more about
Need a deep-dive on the concept behind this application? Look no further. Learn more about this topic, chemistry and related others by exploring similar questions and additional content below.Similar questions
- Please find the open chemical structure of the compound. Please indicate your comments on IR, 1H-NMR and Mass Spectrum. Identify IR peaks for the compound’s bonds. Idetify integration values in NMR spectrum for each peak. Show fragmentation in Mass spectrum. Identify molecular ion and base peaks. Explain in details how do you find the open structure of the compound. According to these images;arrow_forwardDraw the structure of the product in your notebook. Using the provided spectra, assign each set of hydrogen atoms and carbon atoms in the product to the signals in the 1H NMR and 13C NMR spectra. Analyze the IR spectra for 2-methyl-2-propanol and 2-chloro-2-methylpropane. Identify the bands in each spectra that are needed to confirm the disappearance of the alcohol band and appearance of the new C-Cl band.? Please don't provide hand written solution......arrow_forward4arrow_forward
- The options to choose from are: -Relative number and number of types of hydrogen -absolute number and number of types of hydrogen -confirms molecular weight of molecule -relative number and number of types of carbon -confirms presence of functional groups -number of types of carbon -relative number of functional groupsarrow_forwardSuggest structures given the 1H NMR spectra and formulas for each of the compounds below. C9H10Oarrow_forwardQUESTION 8 Select the functional group present in the molecule with formula C7H₁20 and the IR spectrum seen below: LOD TRANSMITTANCE!! 5D D+ 4000 2932 4 1396 2908 1362 13 2856 8 2809 37 2705 35 1727 5 1461 Alcohol Aldehyde Ether Ketone 1351 1329 1300 1285 17 1267 3000 64 66 72 72 6B 62 72 70 1233 1224 74 84 1189 1170 7 70 64 1156 1144 BO 68 1133 2000 66 1099 1084 58 68 1050 1038 72 72 1033 1025 70 967 42 HAVENUMBERI- 943 67 916 55 893 52 842 74 829 74 761 681 Click Save and Submit to save and submit. Click Save All Answers to save all answers. 72 66 1500 mm www 1000 mm 500arrow_forward
- The functional groups in an organic compound can frequently be deduced from its infrared absorption spectrum. A compound exhibits strong, broad absorption between 3300 and 3500 and at 1050 cm-1. Relative absorption intensity: (s)=strong, (m)=medium, (w)=weak. What functional class(es) does the compound belong to? List only classes for which evidence is given here. Attach no significance to evidence not cited explicitly. Do not over-interpret exact absorption band positions. None of your inferences should depend on small differences like 10 to 20 cm-1. The functional class(es) of this compound is(are) -(Enter letters from the table below, in any order, with no spaces or commas.) a. alkane (List only if no other functional class applies.) b. alkene c. terminal alkyne d. internal alkyne h. amine i. aldehyde or ketone j. carboxylic acid k. ester I. nitrile e. arene f. alcohol g. etherarrow_forward1.Predict the structure that would give the following ¹H and ¹3C-NMR spectra for C₂H5CI: 3.6 ille 9.0 40 3.5 8.0 35 3.4 3.3 CHCl3 7.0 30 6.0 سد 25 1.80 1.70 1.60 5.0 4.0 Chemical shift (8, ppm) 20 PPM 2H T 15 3.0 2.0 10 3H 1.0 5 TMS 0.0 0arrow_forwardpredict the structure of the unknown compound using the image attached. Annotate all spectraEach spectra must be used to arrive at the answerThis means each piece of provided information should be annotated in some way depending on the type of analysis and information gained from it.calculate the HDI for proposed structure and provide the chemical formulaarrow_forward
- What is the structure of this molecule and ignore the 77 ppm triad in Csrbon-13 NMR. Mass of structure is 162.arrow_forwardShown are the H NMR spectra for 2 isomeric compounds three and four of the formula C5H10O. The IR spectrum of both have an absorption in the region of 1700 to 1730 cm-1. Provide the structure for each compound, and which hydrogen atoms give rise to the peaks in each spectrum. The peak at 7.27 ppm can be ignored, and the red numbers are integration values.arrow_forwardSuggest structures given the 1H NMR spectra and formulas for each of the compounds below. C4H10Oarrow_forward
arrow_back_ios
SEE MORE QUESTIONS
arrow_forward_ios
Recommended textbooks for you
 ChemistryChemistryISBN:9781305957404Author:Steven S. Zumdahl, Susan A. Zumdahl, Donald J. DeCostePublisher:Cengage Learning
 ChemistryChemistryISBN:9781259911156Author:Raymond Chang Dr., Jason Overby ProfessorPublisher:McGraw-Hill Education
 Principles of Instrumental AnalysisChemistryISBN:9781305577213Author:Douglas A. Skoog, F. James Holler, Stanley R. CrouchPublisher:Cengage Learning
 Organic ChemistryChemistryISBN:9780078021558Author:Janice Gorzynski Smith Dr.Publisher:McGraw-Hill Education
 Chemistry: Principles and ReactionsChemistryISBN:9781305079373Author:William L. Masterton, Cecile N. HurleyPublisher:Cengage Learning
 Elementary Principles of Chemical Processes, Bind...ChemistryISBN:9781118431221Author:Richard M. Felder, Ronald W. Rousseau, Lisa G. BullardPublisher:WILEY

Chemistry
Chemistry
ISBN:9781305957404
Author:Steven S. Zumdahl, Susan A. Zumdahl, Donald J. DeCoste
Publisher:Cengage Learning

Chemistry
Chemistry
ISBN:9781259911156
Author:Raymond Chang Dr., Jason Overby Professor
Publisher:McGraw-Hill Education

Principles of Instrumental Analysis
Chemistry
ISBN:9781305577213
Author:Douglas A. Skoog, F. James Holler, Stanley R. Crouch
Publisher:Cengage Learning

Organic Chemistry
Chemistry
ISBN:9780078021558
Author:Janice Gorzynski Smith Dr.
Publisher:McGraw-Hill Education

Chemistry: Principles and Reactions
Chemistry
ISBN:9781305079373
Author:William L. Masterton, Cecile N. Hurley
Publisher:Cengage Learning

Elementary Principles of Chemical Processes, Bind...
Chemistry
ISBN:9781118431221
Author:Richard M. Felder, Ronald W. Rousseau, Lisa G. Bullard
Publisher:WILEY