FINANCIAL ACCOUNTING
10th Edition
ISBN: 9781259964947
Author: Libby
Publisher: MCG
expand_more
expand_more
format_list_bulleted
Question
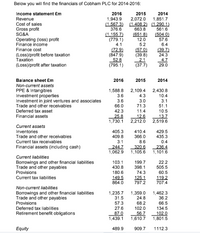
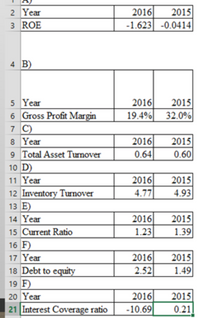
Using the financial statements and using these ratios from the picture, discuss the performance of Cobham PLC in 2016.

Transcribed Image Text:Below you will find the financials of Cobham PLC for 2014-2016:
Income statement £m
2016
2015
2014
Revenue
1,943.9
(1.567.3)
376.6
1,851.7
(1.408.2) (1.290.1)
561.6
(504.0)
57.6
2,072.0
Cost of sales
Gross profit
663.8
(1,155.7)
(779.1)
4.1
SG&A
(651.8)
12.0
Operating (loss) profit
Finance income
5.2
6.4
(72.9)
(847.9)
52.8
(795.1)
Finance cost
(57.0)
(39.8)
2.1
(37.7)
(39.7)
24.3
(Loss)/profit before taxation
Таxation
4.7
(Loss)/profit after taxation
29.0
Balance sheet £m
2016
2015
2014
Non-current assets
PPE & Intangibles
Investment properties
Investment in joint ventures and associates
Trade and other receivables
1,588.8
2,109.4
4.3
3.0
2,430.8
3.6
10.4
3.6
3.1
66.0
71.3
51.1
Deferred tax asset
42.3
11.4
10.5
25.8
1,730.1
Financial assets
12.6
2,212.0
13.7
2,519.6
Current assets
Inventories
405.3
410.4
429.5
Trade and other receivables
409.8
366.0
435.3
0.4
236.4
1,101.6
Current tax receivables
3.1
8.6
Financial assets (including cash)
244.7
1,062.9
320.6
1,105.6
Current liabilities
Borrowings and other financial liabilities
Trade and other payables
199.7
398.1
103.1
22.2
430.8
505.5
Provisions
180.6
74.3
60.5
Current tax liabilities
149.5
864.0
125.1
797.2
119.2
707.4
Non-current liabilities
Borrowings and other financial liabilities
Trade and other payables
1,235.7
31.5
1,359.0
24.8
1,462.3
36.2
Provisions
57.3
27.6
87.0
68.2
66.5
Deferred tax liabilities
102.0
134.5
Retirement benefit obligations
56.7
102.0
1,801.5
1,439.1
1,610.7
Equity
489.9
909.7
1112.3

Transcribed Image Text:2 Year
2016
2015
3 ROE
-1.623 -0.0414
4 B)
5 Year
6 Gross Profit Margin
7 C)
2016|
19.4%
2015
32.0%
7
2016
2015
0.60
8 Year
9 Total Asset Turnover
0.64
10 D)
2016
4.77
2015
4.93
11 Year
12 Inventory Turnover
13 E)
14 Year
2016
2015
15 Current Ratio
1.23
1.39
16 F)
2016
2.52
17 Year
2015
18 Debt to equity
19 F)
1.49
2016
-10.69
2015
0.21
20 Year
21 Interest Coverage ratio
Expert Solution
This question has been solved!
Explore an expertly crafted, step-by-step solution for a thorough understanding of key concepts.
Step by stepSolved in 2 steps

Knowledge Booster
Learn more about
Need a deep-dive on the concept behind this application? Look no further. Learn more about this topic, accounting and related others by exploring similar questions and additional content below.Similar questions
- RATIO ANALYSIS The Corrigan Corporation’s 2017 and 2018 financial statements follow,along with some industry average ratios.a. Assess Corrigan’s liquidity position, and determine how it compares with peers andhow the liquidity position has changed over time.b. Assess Corrigan’s asset management position, and determine how it compares withpeers and how its asset management efficiency has changed over time.c. Assess Corrigan’s debt management position, and determine how it compares withpeers and how its debt management has changed over time.d. Assess Corrigan’s profitability ratios, and determine how they compare with peersand how its profitability position has changed over time.e. Assess Corrigan’s market value ratios, and determine how its valuation compares withpeers and how it has changed over time. Assume the firm’s debt is priced at par, sothe market value of its debt equals its book value. f. Calculate Corrigan’s ROE as well as the industry average ROE, using the DuPontequation.…arrow_forwarda) Calculate the following ratios for 2016 and 2015, showing detailed calculations as to how you arrive at each number. A ROE B Gross profit margin C Total asset turnover D Inventory turnover E Current ratio F Debt-to-equity G Interest coverage ratio. b) Using the financial statements and the ratios calculated above (and any other ratios you like to calculate), discuss the performance of Cobham PLC in 2016. c) Critically discuss the need for the public limited companies to prepare a Statement of Cash Flows and explain the usefulness of the information contained therein from the perspective of a financial analyst.arrow_forwardCalculate the financial indicators of the firm Merck for the year 2018 and fill in the spaces marked in the table. Company Name: Year 2018 Chemicals and Allied Products Industry Ratios ………….. Solvency or Debt Ratios Merck J&J 2018 Debt ratio …. …. 0.47 Debt-to-equity ratio …. …. 0.38 Interest coverage ratio …. …. -9.43 Liquidity Ratios Current ratio …. …. 3.47 Quick ratio …. …. 2.12 Cash ratio …. …. 2.24 Profitability Ratios Profit margin …. …. -93.4% ROE (Return on equity), after tax …. …. -248.5 ROA (Return on assets) …. …. -146.5 Gross margin …. …. 55.3% Operating margin (Return on sales) …. …. -42.9% Activity or Efficiency Ratios Asset turnover …. …. 1.08 Receivables turnover (days) …. …. 16 Inventory turnover (days)…arrow_forward
- Find in the Selected Financial Data or calculate, the following data: Dividends per share declared in 2017. Capital expenditures in 2016. Year total equity grew by the greatest amount over the previous year. Change in total debt from 2013 to 2017.arrow_forwardWhich of the following ratios best measures the profitability of a company? a) Return on equity b) Gross margin c) Current ratio d) Net operating asset turnoverarrow_forwardWhich of the following ratios helps in measuring the long term solvency of the company? Current ratio Debt equity ratio Net profit margin ratio Quick ratioarrow_forward
- DuPont system of analysis Use the following financial information for AT&T and Verizon to conduct a DuPont system of analysis for each company. Sales Earnings available for common stockholders Total assets Stockholders' equity a. Which company has the higher net profit margin? Higher asset turnover? b. Which company has the higher ROA? The higher ROE? c. Which company has the higher financial leverage multiplier? a. Net profit margin (Round to three decimal places.) AT&T Net profit margin AT&T $164,000 13,333 403,921 201,934 Verizon Verizon $126,280 13,608 244,280 24,232arrow_forwardAccounting Questionarrow_forwardi, j and karrow_forward
- Which of the following ratios is used to analyze a company's liquidity? a. Inventory turnover ratio b. Earnings per share c. Return on assets ratio d. Asset turnover ratioarrow_forwardCalculate the ratios of Woolworths Group (Australian retail company) for the year 2021: Ratios to calculate: Profitability (ROSF, ROCE, Gross margin, Operating profit margin, Cash flow to Sales*) Efficiency (Inventory turnover period, Average settlement period, Sales revenue to capital employed) Liquidity (Current ratio, Acid test (quick) ratio, Cash flow ratio*). Stability/Capital Structure (Gearing ratio, Interest cover ratio, Debt coverage ratio*) Investment/Market Performance (Earnings per share, Price earnings ratio, Operating cash flow per share*)arrow_forwardIf given the opportunity, in which of the firms would you invest based on the result of your analysis of both companies and the comparison with the industry? If you would not invest, explain your reasons according to the results obtained. Company Name: Year 2018 Chemicals and Allied Products Industry Ratios ………….. Solvency or Debt Ratios Merck J&J 2018 Debt ratio 0.67 0.61 0.47 Debt-to-equity ratio 0.93 0.51 0.38 Interest coverage ratio 12.27 18.91 -9.43 Liquidity Ratios Current ratio 1.17 1.47 3.47 Quick ratio 0.92 1.16 2.12 Cash ratio 0.40 0.63 2.24 Profitability Ratios Profit margin 14.64% 18.75% -93.4% ROE (Return on equity), after tax 23.03% 25.60% -248.5 ROA (Return on assets) 7.49% 10.00% -146.5 Gross margin 68.06% 66.79% 55.3% Operating margin (Return on sales) 19.62% 24.27%…arrow_forward
arrow_back_ios
SEE MORE QUESTIONS
arrow_forward_ios
Recommended textbooks for you

 AccountingAccountingISBN:9781337272094Author:WARREN, Carl S., Reeve, James M., Duchac, Jonathan E.Publisher:Cengage Learning,
 Accounting Information SystemsAccountingISBN:9781337619202Author:Hall, James A.Publisher:Cengage Learning,
 Horngren's Cost Accounting: A Managerial Emphasis...AccountingISBN:9780134475585Author:Srikant M. Datar, Madhav V. RajanPublisher:PEARSON
 Intermediate AccountingAccountingISBN:9781259722660Author:J. David Spiceland, Mark W. Nelson, Wayne M ThomasPublisher:McGraw-Hill Education
 Financial and Managerial AccountingAccountingISBN:9781259726705Author:John J Wild, Ken W. Shaw, Barbara Chiappetta Fundamental Accounting PrinciplesPublisher:McGraw-Hill Education


Accounting
Accounting
ISBN:9781337272094
Author:WARREN, Carl S., Reeve, James M., Duchac, Jonathan E.
Publisher:Cengage Learning,

Accounting Information Systems
Accounting
ISBN:9781337619202
Author:Hall, James A.
Publisher:Cengage Learning,

Horngren's Cost Accounting: A Managerial Emphasis...
Accounting
ISBN:9780134475585
Author:Srikant M. Datar, Madhav V. Rajan
Publisher:PEARSON

Intermediate Accounting
Accounting
ISBN:9781259722660
Author:J. David Spiceland, Mark W. Nelson, Wayne M Thomas
Publisher:McGraw-Hill Education

Financial and Managerial Accounting
Accounting
ISBN:9781259726705
Author:John J Wild, Ken W. Shaw, Barbara Chiappetta Fundamental Accounting Principles
Publisher:McGraw-Hill Education