Concept explainers
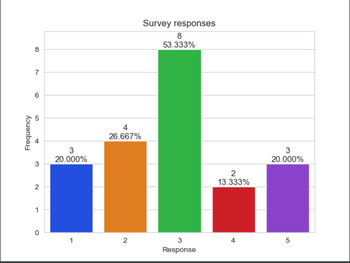
Using Python Matplot display a bar chart showing the response frequencies and their percentages of the total responses.
This is the list below to use
Twenty students were asked to rate on a scale of 1 to 5 the quality of the food in the student cafeteria, with 1 being “awful” and 5 being “excellent.”
1, 2, 5, 4, 3, 5, 2, 1, 3, 3, 1, 4, 3, 3, 3, 2, 3, 3, 2, 5
Bar chart should look like the image below

Python
Popular general-purpose programming language Python is used frequently. It is employed in many different domains, including desktop software, online development, and machine learning. Python, thankfully, has a straightforward syntax that is simple to use. This makes Python a fantastic language for novices to learn.
Step by stepSolved in 3 steps with 1 images

 Database System ConceptsComputer ScienceISBN:9780078022159Author:Abraham Silberschatz Professor, Henry F. Korth, S. SudarshanPublisher:McGraw-Hill Education
 Starting Out with Python (4th Edition)Computer ScienceISBN:9780134444321Author:Tony GaddisPublisher:PEARSON
 Digital Fundamentals (11th Edition)Computer ScienceISBN:9780132737968Author:Thomas L. FloydPublisher:PEARSON
 C How to Program (8th Edition)Computer ScienceISBN:9780133976892Author:Paul J. Deitel, Harvey DeitelPublisher:PEARSON
 Database Systems: Design, Implementation, & Manag...Computer ScienceISBN:9781337627900Author:Carlos Coronel, Steven MorrisPublisher:Cengage Learning
 Programmable Logic ControllersComputer ScienceISBN:9780073373843Author:Frank D. PetruzellaPublisher:McGraw-Hill Education


