What is Microsoft Excel?
Microsoft Excel is a useful as well as powerful data analysis and documentation programme. Microsoft Excel is a spreadsheet program developed by Microsoft that is available for Windows, macOS, Android, and iOS. It includes calculation, graphing tools, pivot tables, and a macro programming language called Visual Basic for Applications (VBA).
Microsoft Corporation
The Microsoft Corporation is a technology firm. The firm creates, licenses, and supports a wide range of software products, services, and devices.
Microsoft Office
Microsoft Office, also known as simply Office, is a collection of client software, server software, and services created by Microsoft. It has been a very popular spreadsheet for these platforms, particularly since version 5 in 1993, and it has surpassed Lotus 1-2-3 as the industry standard for spreadsheets. Excel is part of the Microsoft Office software suite.
Office 365
Office 365, which debuted in 2001, is a cloud-based, subscription-based version of Microsoft's popular productivity suite Microsoft Office. Office 365 includes the same core applications as older versions of Office including Word, Excel, PowerPoint, Outlook, OneNote, and depending on the plan purchased, may also include other apps and services such as Publisher, Planner, OneDrive, Exchange, SharePoint, Access, Skype, Yammer, and Microsoft Teams.
One Drive
OneDrive is a Microsoft cloud service that allows you to access all of your files. It allows you to store and protect your files, share them with others, and access them from any device. When you use OneDrive with a company or school account, it's sometimes referred to as "OneDrive for work or school." It was previously known as "OneDrive for Business," so you may still see it referred to as that in places.
Microsoft Excel
Microsoft Excel is an electronic spreadsheet. The worksheet, also known as a spreadsheet, can be used to store data. It can be used to divide your data into rows and columns. It can also be used to quickly perform mathematical calculations. It can show data in the form of line graphs, histograms, and charts, as well as a very limited three-dimensional graphical display. A Sparkline is a small chart that appears in a worksheet cell and provides a visual representation of data. These days most users today will have Excel 2016, 2019 or 365.
Excel Worksheet (Spreadsheet)
A spreadsheet, or Excel worksheet, is a two-dimensional grid with columns and rows. Examine the spreadsheet below. The column names are alphabet letters beginning with A, and the rows are numbered chronologically beginning with one. A1, B1, C1, and so on are the cells in the first row. And the first column's cells are A1, A2, A3, and so on. These are referred to as cell names or cell references. When writing math formulas or functions, we use cell references. For instance, the formula for adding the contents of cells B2 and B3 is: =B2+B3.
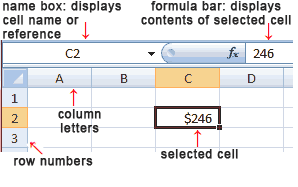
The Name Box, which is situated above Column A, displays the cell reference of the selected cell - the cell where the cursor is currently resting. C2 is the chosen cell in our spreadsheet above. The colour of the column letter (C) and row number (2) has changed.
On our worksheet, the start of the Formula Bar can be seen in the area above Column D. The Formula Bar shows the components of the currently selected cell.
A workbook is a grouping of worksheets or spreadsheets. When you launch the Excel programme, a workbook with three blank worksheets appears. The worksheet names are displayed on tabs at the bottom of the Excel window.
Features of MS Excel
1. Home - Font size, font styles, font colour, background colour, alignment, formatting options and styles, cell insertion and deletion, and editing options are all available at home.
2. Insert - Insert includes options such as table format and style, inserting images and figures, adding graphs, charts, and sparklines, header and footer options, equation and symbols, and so on.
3. Page Layout - The page layout option includes options for themes, orientation, and page setup.
4. Formulas - Because tables with a large amount of data can be created in MS Excel, you can use this feature to add formulas to your table and get faster results.
5. Data - This category includes options for adding external data (from the web), filtering, and data tools.
6. Review - Proofreading can be done in the review category for an excel sheet (similar to spell check), and a reader can add comments in this section.
7. View - The views in which we want the spreadsheet to appear can be changed here. This category includes options for zooming in and out as well as pane arrangement.
Benefits of Excel
- The most effective method of storing data.
- You can do calculations.
- All of the data analysis tools.
- Charts make it simple to visualize data.
- Reports are simple to print.
- There are so many free templates to choose from.
- You can automate by coding.
- Data transformation and cleaning
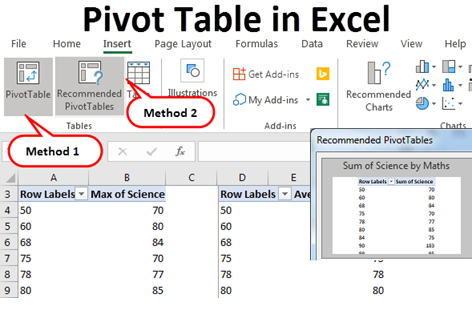
Pivot Table
A pivot table is a statistical table that summarizes the data from a larger table (such as from a database, spreadsheet, or business intelligence program). The Pivot table organizes the Sums, Average and many others statistics in a meaningful way for the summarization . Pivot Table fields are the foundation of pivot tables. Each of the list's fields can be dragged onto this layout, which has four options: Filters,Columns,Rows,Values.
VBA
VBA stands for “Visual Basic for Applications”. Microsoft Excel VBA is Microsoft's programming language for Excel and other Microsoft Office applications such as Word and PowerPoint. The Office suite programmes are all written in the same programming language. Visual Basic for Applications supports the creation of user-defined functions (UDFs), the automation of processes, and the use of dynamic-link libraries to access Windows API and other low-level functionality (DLLs). It supersedes and expands on earlier application-specific macro programming languages, such as Word's WordBASIC. It can be used to control a variety of aspects of the host application.
It can be used to manipulate user interface features such as menus and toolbars, as well as work with custom user forms or dialogue boxes, in addition to controlling many aspects of the host application.
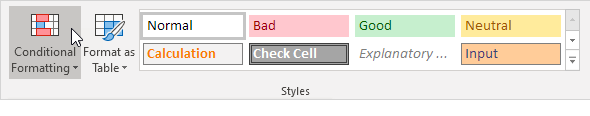
Conditioned Formatting
Excel allows you to change the format of your spreadsheet cells based on their contents. You can also find critical patterns and highlight errors in your data. You can also format numbers, fonts, cell borders, and cell colors with this app. It also lets you format icons, color scales, and data bars for improved visualization.
VLOOKUP Excel Function
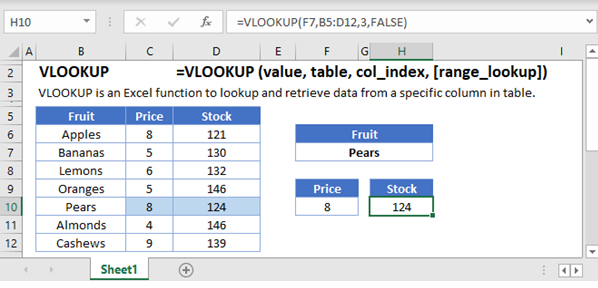
VLOOKUP is an Excel function that searches for data in a vertically organized table. VLOOKUP allows for approximate and exact matching, as well as wildcards (*?) for partial matches. VLOOKUP expects lookup values to be in the first column of the table passed to it.
Syntax
=VLOOKUP (value, table, col_index, [range_lookup])
Arguments
- value - The value to look for in the first column of a table.
- table – The required table from which the value will be retrieved.
- col_index – The particular column that is to be considered.
- range_lookup - [optional] TRUE = approximate match (default). FALSE = exact match.
XLOOKUP Excel Function
Excel's XLOOKUP function is a modern and versatile replacement for older functions such as VLOOKUP, HLOOKUP, and LOOKUP. Approximated and exact both matchings are supported by XLOOKUP. It supports wildcards (*?) for partial matches.
Syntax
=XLOOKUP (lookup, lookup_array, return_array, [not_found], [match_mode], [search_mode])
Arguments
- lookup - The lookup value.
- lookup_array - The array or range to search.
- return_array – Returning the array or the range.
- not_found - [optional] if there is no match then return this value.
- match_mode - [optional] 0 = exact match (default), -1 = exact match or next smallest, 1 = exact match or next larger, 2 = wildcard match.
- search_mode - [optional] 1 = search from first (default), -1 = search from last, 2 = binary search ascending, -2 = binary search descending.
Power Query Excel
Power Query is an Excel business intelligence tool that allows you to import data from a variety of sources and then clean, transform, and reshape it as needed. It enables you to create a query only once and then reuse it with a simple refresh.
Common Mistakes
- Check your calculations.
- On your "what-if" models, highlight the inputs and outputs.
- Avoid inserting rows to create visually appealing spaces as a design feature.
- When you should be using other software, don't use Excel.
- I'm printing the entire spreadsheet, when applying formatting, select the entire column.
- In models, use data validation.
Context & Applications
- Entering and storing data Excel is an excellent tool for both data entry and storage at its most basic level
- Excel is an excellent tool for both data entry and storage at its most basic level
- Collection and Verification of Business Data
- Administrative and managerial duties
- Accounting and budgeting
- Data Analysis
- Reporting + Visualizations
- Forecasting.
Related Concepts
XML Spreadsheet
Freeze Panes in MS-Excel
Want more help with your computer science homework?
*Response times may vary by subject and question complexity. Median response time is 34 minutes for paid subscribers and may be longer for promotional offers.
Search. Solve. Succeed!
Study smarter access to millions of step-by step textbook solutions, our Q&A library, and AI powered Math Solver. Plus, you get 30 questions to ask an expert each month.
Excel Homework Questions from Fellow Students
Browse our recently answered Excel homework questions.
Search. Solve. Succeed!
Study smarter access to millions of step-by step textbook solutions, our Q&A library, and AI powered Math Solver. Plus, you get 30 questions to ask an expert each month.