MATLAB: An Introduction with Applications
6th Edition
ISBN: 9781119256830
Author: Amos Gilat
Publisher: John Wiley & Sons Inc
expand_more
expand_more
format_list_bulleted
Question
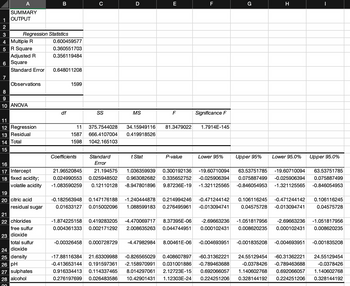
- Using 1% & 5% alphas, test the overall significance of the model.

Transcribed Image Text:A
SUMMARY
1 OUTPUT
WN
2
3
4 Multiple R
5 R Square
Regression Statistics
7
Adjusted R
6 Square
Standard Error
Observations
8
9
10 ANOVA
11
12 Regression
13 Residual
14 Total
15
16
17 Intercept
18 fixed acidity;
volatile acidity
19
20 citric acid
residual sugar
21
22 chlorides
free sulfur
23 dioxide
total sulfur
B
24 dioxide
25 density
26 pH
27 sulphates
28 alcohol
00
0.600459577
0.360551703
0.356119484
0.648011208
df
1599
с
Coefficients
SS
D
11 375.7544028 34.15949116
1587 666.4107004 0.419918526
1598 1042.165103
Standard
Error
21.96520845 21.194575
0.024990553 0.025948502
-1.083590259 0.12110128
MS
t Stat
E
F
P-value
F
81.3479022 1.7914E-145
Significance F
-1.874225158 0.419283205 -4.470069717 8.37395E-06
0.004361333 0.002171292 2.008635263 0.044744951
Lower 95%
G
Upper 95%
H
Lower 95.0%
|
Upper 95.0%
1.036359939 0.300192136 -19.60710094 63.53751785 -19.60710094 63.53751785
0.963082682 0.335652752 -0.025906394 0.075887499 -0.025906394 0.075887499
-8.947801896 9.87236E-19 -1.321125565 -0.846054953 -1.321125565 -0.846054953
-0.182563948 0.147176188 -1.240444878 0.214994246 -0.471244142 0.106116245 -0.471244142 0.106116245
0.01633127 0.015002096 1.088599183 0.276495961 -0.013094741 0.04575728 -0.013094741 0.04575728
-2.69663236 -1.051817956 -2.69663236 -1.051817956
0.000102431 0.008620235 0.000102431 0.008620235
-0.00326458 0.000728729 -4.47982984 8.00461E-06 -0.004693951 -0.001835208 -0.004693951 -0.001835208
-17.88116384 21.63309988 -0.826565029 0.408607897 -60.31362221 24.55129454 -60.31362221 24.55129454
-0.413653144 0.191597361 -2.158970991 0.031001886 -0.789463688 -0.0378426 -0.789463688
0.916334413 0.114337465 8.014297061 2.12723E-15 0.692066057 1.140602768 0.692066057
0.276197699 0.026483586 10.42901431 1.12303E-24 0.224251206 0.328144192 0.224251206
-0.0378426
1.140602768
0.328144192
Expert Solution
This question has been solved!
Explore an expertly crafted, step-by-step solution for a thorough understanding of key concepts.
Step by stepSolved in 3 steps

Knowledge Booster
Similar questions
- Need help writing a null hypothesis for the bivariate relationship shown in the SPSS output.arrow_forwardA researcher plans to study the causal effect of police on crime using data from a random sample of U.K. counties. He plans to regress the county’s crime rate on the (per capita) size of the county’s police force. Explain why this regression is likely to suffer from omitted variable bias. Which variable would you add to the regression to controlfor important omitted variable? Determine whether the regression will likely over or underestimate the effect of police on the crime rate?arrow_forwardRide services are on the rise, such as Uber and Lyft. You wondered if the recent news reports of crime occurring with these ride services impacted the usage of them, especially with women. You decide to conduct a survey about ride service usage among male and female college students. The results showed that 19 males use ride services and 11 do not. While 12 females use ride services and 18 do not. Calculate the chi-square statistic:arrow_forward
- Please see attachedarrow_forwardProvide an example of a regression that arguably would have a high value of R² but would produce biased and inconsistent estimators of a causal effect. Explain why the R² is likely to be high. Explain why the OLS estimators would be biased and inconsistent.arrow_forwardExercise: Suppose α = 1%. Find Z0.01 and the rejection region. Answer:arrow_forward
- You run a regression analysis on a bivariate set of data (n = 22). With ☎ = 22.3 and y = 58.5, you obtain the regression equation y = 0.842x + 37.664 with a correlation coefficient of r = 0.897. You want to predict what value (on average) for the response variable will be obtained from a value of 180 as the explanatory variable. What is the predicted response value? y = (Report answer accurate to one decimal place.)arrow_forwardYou run a regression analysis on a bivariate set of data (n = 120). With i = 66.3 and y = 50.6, you obtain the regression equation y = 4.097x – 11.636 with a correlation coefficient of r = 0.56. You want to predict what value (on average) for the response variable will be obtained from a value of 120 as the explanatory variable. What is the predicted response value? y = (Report answer accurate to one decimal place.)arrow_forwardThe value of PRESS for five different regression models are A = 42.3, B = 47.4, C = 51.5, D =40.6, and E = 54.6. Based only on this statistic, which model is preferred?arrow_forward
arrow_back_ios
arrow_forward_ios
Recommended textbooks for you
 MATLAB: An Introduction with ApplicationsStatisticsISBN:9781119256830Author:Amos GilatPublisher:John Wiley & Sons Inc
 Probability and Statistics for Engineering and th...StatisticsISBN:9781305251809Author:Jay L. DevorePublisher:Cengage Learning
 Statistics for The Behavioral Sciences (MindTap C...StatisticsISBN:9781305504912Author:Frederick J Gravetter, Larry B. WallnauPublisher:Cengage Learning
 Elementary Statistics: Picturing the World (7th E...StatisticsISBN:9780134683416Author:Ron Larson, Betsy FarberPublisher:PEARSON
 The Basic Practice of StatisticsStatisticsISBN:9781319042578Author:David S. Moore, William I. Notz, Michael A. FlignerPublisher:W. H. Freeman
 Introduction to the Practice of StatisticsStatisticsISBN:9781319013387Author:David S. Moore, George P. McCabe, Bruce A. CraigPublisher:W. H. Freeman

MATLAB: An Introduction with Applications
Statistics
ISBN:9781119256830
Author:Amos Gilat
Publisher:John Wiley & Sons Inc

Probability and Statistics for Engineering and th...
Statistics
ISBN:9781305251809
Author:Jay L. Devore
Publisher:Cengage Learning

Statistics for The Behavioral Sciences (MindTap C...
Statistics
ISBN:9781305504912
Author:Frederick J Gravetter, Larry B. Wallnau
Publisher:Cengage Learning

Elementary Statistics: Picturing the World (7th E...
Statistics
ISBN:9780134683416
Author:Ron Larson, Betsy Farber
Publisher:PEARSON

The Basic Practice of Statistics
Statistics
ISBN:9781319042578
Author:David S. Moore, William I. Notz, Michael A. Fligner
Publisher:W. H. Freeman

Introduction to the Practice of Statistics
Statistics
ISBN:9781319013387
Author:David S. Moore, George P. McCabe, Bruce A. Craig
Publisher:W. H. Freeman