A First Course in Probability (10th Edition)
10th Edition
ISBN: 9780134753119
Author: Sheldon Ross
Publisher: PEARSON
expand_more
expand_more
format_list_bulleted
Concept explainers
Topic Video
Question

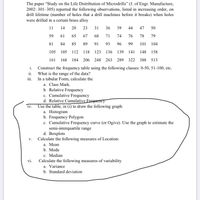
Transcribed Image Text:The paper "Study on the Life Distribution of Microdrills" (J. of Engr. Manufacture,
2002: 301–305) reported the following observations, listed in increasing order, on
drill lifetime (number of holes that a drill machines before it breaks) when holes
were drilled in a certain brass alloy
11
14
20
23
31
36
39
44
47
50
59
61
65
67
68
71
74
76
78
79
81
84
85
89
91
93
96
99
101
104
105
105
112
118
123
136
139 141
148
158
161
168
184 206 248 263 289 322 388 513
i. Construct the frequency table using the following classes: 0-50, 51-100, etc.
ii. What is the range of the data?
iii. In a tabular Form, calculate the
a. Class Mark.
b. Relative Frequency
c. Cumulative Frequency
d. Relative Cumulative Frequency
iv. Use the table, in (i) to draw the following graph:
a. Histogram
b. Frequency Polygon
c. Cumulative Frequency curve (or Ogive). Use the graph to estimate the
semi-interquartile range
d. Boxplots
v. Calculate the following measures of Location:
а. Мean
b. Mode
c. Median
Calculate the following measures of variability
vi.
a. Variance
b. Standard
iation

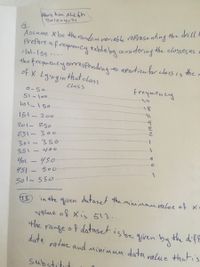
Transcribed Image Text:Abra him Ale hh
20120402
Assume Xbe therandon vriehh refresenhing the drill
Prefare a frequency table by considering the closses as o
lol-159
the frequnency coresponding to aparticular class is the
of X Lyingin that class.
Class
O-50
frequency
51-100
l0-150
151-200
201- 250
2
2.
251-300
301-350
351-400
Yo1 -450
451-500
501-550
) in the dutaset the mina'nmu value of x
given
99ue of X is 513.
the
range of dataset is be given by the diff
data rabue andminimmm data value thatis
Substitud
Expert Solution
This question has been solved!
Explore an expertly crafted, step-by-step solution for a thorough understanding of key concepts.
Step by stepSolved in 7 steps with 4 images

Knowledge Booster
Learn more about
Need a deep-dive on the concept behind this application? Look no further. Learn more about this topic, probability and related others by exploring similar questions and additional content below.Similar questions
- Answer the following tablearrow_forwardUse the graph to answer the following questions. Frequency 7 6+ 5 40 Cost of Student Groceries Cost ($) a. Is this graph symmetric or skewed? 100 b. For this graph, is mean or median the best choice for the measure of center? c. For this graph, is standard deviation or IQR the best choice for the measure of variation? d. For this graph, the mean is expected to be the median. (higher than, lower than, or about the same as?)arrow_forwardUse the following cell phone airport data speeds (Mbps) from a particular network. Find the percentile corresponding to the data speed 0.9 Mbps. 0.2 0.2 0.3 0.4 0.4 0.6 0.6 0.7 0.7 0.7 0.8 0.8 0.9 0.9 0.9 0.9 1.2 1.3 1.8 1.9 1.9 2.3 2.3 2.4 2.4 2.9 3.1 3.3 3.9 4.6 4.7 5.2 5.3 5.6 6.3 7.1 7.1 7.7 8.3 8.4 8.8 9.6 9.8 9.9 13.4 13.8 13.9 14.4 15.7arrow_forward
- Use the following cell phone airport data speeds (Mbps) from a particular network. Find the percentile corresponding to the data speed 0.6 Mbps. 0.1 0.2 0.4 0.6 0.6 1.1 1.6 2.4 2.7 3.8 6.1 9.2 13.6 14.6 15.3 0.1 0.6 1.8 4.6 13.9 0.2 0.6 2.3 5.8 14.4 Percentile of 0.6= (Round to the nearest whole number as needed.) 0.2 0.8 2.5 7.3 14.7 (…) 0.3 0.9 2.7 7.6 14.9 0.5 1.2 2.9 9.3 15.5 0.5 1.3 2.9 12.5 15.5 0.5 1.3 3.7 12.6 25.5arrow_forwardUse the following cell phone airport data speeds (Mbps) from a particular network. Find the percentile corresponding to the data speed 9.6 Mbps. 0.1 0.1 0.2 0.2 0.3 0.4 0.4 0.4 0.5 0.5 0.5 0.5 0.7 0.8 0.8 0.9 0.9 1.2 1.2 1.3 1.5 1.5 1.8 2.1 2.2 2.4 2.4 2.7 3.7 3.8 3.9 4.8 5.1 5.5 6.2 6.2 6.3 7.7 8.8 9.3 9.3 9.6 9.8 11.8 13.9 14.1 14.7 15.5 15.7 28.3arrow_forwardUse the following cell phone airport data speeds (Mbps) from a particular network. Find the percentile corresponding to the data speed 0.9 Mbps. 0.6 0.6 0.7 0.7 D 0.5 0.5 0.6 0.2 0.4 0.5 1.4 1.5 1.6 0.9 1.2 1.4 0.7 0.9 0.9 2.8 3.2 0.7 2.5 2.5 2.6 1.9 2.2 2.3 8.8 1.6 1.7 8.2 8.2 8.3 5.7 6.6 6.7 3.6 3.7 4.9 15.3 15.5 30.6 14.8 15.1 15.3 11.9 14.5 8.9 9.1 ..... Percentile of 0.9 = (Round to the nearest whole number as needed.) Next MacBook DII DD F12 F11 F10 F9 000 000 F8 F7 F5 F6 F4 esc F3 F1 @ # $ del 7 2 4 { } E R T Y U Q W tab G H J K L F A + II * 00arrow_forward
- Complete the following frequency chart.A frequency chart of temperatures Temperature Frequency Relative Frequency 70 - 74 75 - 79 80 - 84 85 - 89 90 - 94 From the frequency chart, calculate the mean. How does the mean from the raw data (question 7) compare to the mean from the grouped data (question 9)? Use the frequency chart to create a histogram of the daily high temperatures at Cox-Dayton International Airport for June and July 2018. Describe the distribution by shape, center, and spread. Also, state whether there are any outliers.arrow_forwardMs. Lorraine Finch, a fifth grade teacher has a large class of 50 students for the 2018 - 2019 school year. After giving a reading comprehension test, Ms. Finch decided to do a brief statistical analysis. A frequency distribution of the results is presented below. a. Fill in the missing pa rts of Ms. Finch’s frequency distribution. Do any necessary scrap work in the space next to the table. b. Construct a histogram of the frequency distribution. c Is the distribution of test scores normal? Explain. Score Frequency Relative Frequency 84 2 0.04 85 5 0.1 86 0.08 87 8 0.16 88 10 89 90 5 0.1 91 4 0.08 92 3 0.06arrow_forwardThe following shows a linear correlation between weight and height. Image result for scatter plot scatter plot positive histogram negative O pie chart random frequency polygon biasedarrow_forward
arrow_back_ios
arrow_forward_ios
Recommended textbooks for you
 A First Course in Probability (10th Edition)ProbabilityISBN:9780134753119Author:Sheldon RossPublisher:PEARSON

A First Course in Probability (10th Edition)
Probability
ISBN:9780134753119
Author:Sheldon Ross
Publisher:PEARSON
