
MATLAB: An Introduction with Applications
6th Edition
ISBN: 9781119256830
Author: Amos Gilat
Publisher: John Wiley & Sons Inc
expand_more
expand_more
format_list_bulleted
Related questions
Question
A) find the critical value(s) assuming that the population variances are equal .
b) find the Curitiba value(s) assuming that they population variances are not equal .
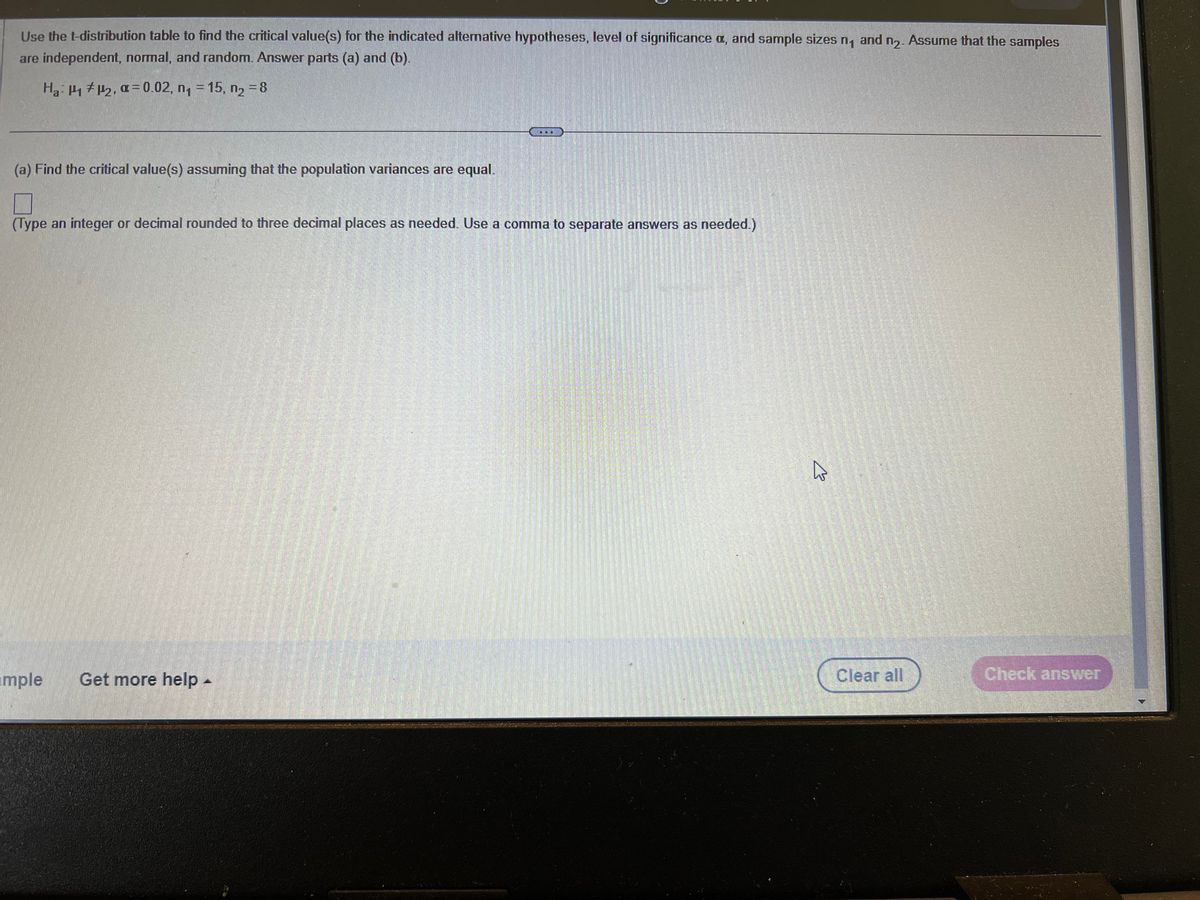

Transcribed Image Text:Use the t-distribution table to find the critical value(s) for the indicated alternative hypotheses, level of significance a, and sample sizes n, and n₂. Assume that the samples
are independent, normal, and random. Answer parts (a) and (b).
Ha: P1 P₂, α=0.02, n₁ = 15, n₂ = 8
(a) Find the critical value(s) assuming that the population variances are equal.
(Type an integer or decimal rounded to three decimal places as needed. Use a comma to separate answers as needed.)
imple
Get more help
k
Clear all
Check answer
Expert Solution
This question has been solved!
Explore an expertly crafted, step-by-step solution for a thorough understanding of key concepts.

Step by stepSolved in 3 steps with 1 images

Knowledge Booster

Similar questions
- Heights (cm) and weights (kg) are measured for 100 randomly selected adult males, and range from heights of 133 to 188 cm and weights of 40 to 150 kg. Let the predictor variable x be the first variable given. The 100 paired measurements yield x = 167.54 cm, y = 81.35 kg, r=0.186, P-value = 0.064, and y = - 109 + 1.12x. Find the best predicted value of ŷ (weight) given an adult male who is 180 cm tall. Use a 0.10 significance level. The best predicted value of y for an adult male who is 180 cm tall is (Round to two decimal places as needed.) kg.arrow_forwardHeights (cm) and weights (kg) are measured for 100 randomly selected adult males, and range from heights of 138 to 188 cm and weights of 40 to 150 kg. Let the predictor variable x be the first variable given. The 100 paired measurements yield x = 167.61 cm, y = 81.52 kg, r=0.271, P-value=0.006, and y = -103 +1.18x. Find the best predicted value of ŷ (weight) given an adult male who is 155 cm tall. Use a 0.10 significance level. The best predicted value of y for an adult male who is 155 cm tall is (Round to two decimal places as needed.) kg.arrow_forwardAn engineer wants to know if producing metal bars using a new experimental treatment rather than the conventional treatment makes a difference in the tensile strength of the bars (the ability to resist tearing when pulled lengthwise). At α=0.10, answer parts (a) through (e). Assume the population variances are equal and the samples are random. If convenient, use technology to solve the problem. Treatment Tensile strengths (newtons per square millimeter) Experimental 449 354 450 360 433 388 400 Conventional 370 376 374 424 378 450 438 404 352 376 (a) Identify the claim and state H0 and Ha. The claim is "The new treatment ▼ makes a difference does not make a difference in the tensile strength of the bars." What are H0 and Ha? The null hypothesis, H0, is ▼ mu 1 equals mu 2μ1=μ2 mu 1 less than or equals mu 2μ1≤μ2 mu 1 greater than or equals mu 2μ1≥μ2 . The alternative hypothesis, Ha,…arrow_forward
- Mist (airborne droplets or aerosols) is generated when metal- removing fluids are used in machining operations to cool and lubricate the tool and workpiece. Mist generation is a concern to OSHA, which has recently lowered substantially the workplace standard. The article "Variables Affecting Mist Generaton from Metal Removal Fluids" (Lubrication Engr., 2002: 10-17) gave the accompanying data on x = fluid-flow velocity for a 5% soluble oil (cm/sec) and y = the extent of mist droplets having diameters smaller than 10 μm (mg/m³): x y 89 177 189 354 362 442 965 .40 .60 .48 .66 .61 .69 .99 a. The investigators performed a simple linear regres- sion analysis to relate the two variables. Does a scat- terplot of the data support this strategy? b. What proportion of observed variation in mist can be attributed to the simple linear regression relationship between velocity and mist? c. The investigators were particularly interested in the impact on mist of increasing velocity from 100 to 1000 (a…arrow_forwardThe length (in mm) of a spring subjected to a force FNewtons is of the form L = a + BF+ ɛ, where ɛ is assumed normally distributed with mean 0, variance o2. Given the sample statisticsn=D13, E F;= 138, E L; = 577, SEL = -43, SEF= 1735, estimate the expected length of the spring when a force of 11.2 Newtons is applied. (Give your answer correct to 2 decimal places.) Answer: Ti Check 江一 prime viden Type here to search 19 hp ins prt fu f12 f8 f9 f10 f7 f5 f6 『米 " JOI JDI & 6 7 8 5 96 %24 3arrow_forwardHeights (cm) and weights (kg) are measured for 100 randomly selected adult males, and range from heights of 132 to 193 cm and weights of 39 to 150 kg. Let the predictor variable x be the first variable given. The 100 paired measurements yield x = 167.59 cm, y = 81.52 kg, r= 0.416, P-value = 0.000, and y = - 102 + 1.13x. Find the best predicted value of y (weight) given an adult male who is 147 cm tall. Use a 0.05 significance level. The best predicted value of y for an adult male who is 147 cm tall is kg. (Round to two decimal places as needed.)arrow_forward
- Heights (cm) and weights (kg) are measured for 100 randomly selected adult males, and range from heights of 137 to 189 cm and weights of 37 to 150 kg. Let the predictor variable x be the first variable given. The 100 paired measurements yield x = 167.50 cm, y =81.41 kg, r=0.232, P-value = 0.020, and y = - 109 + 1.17x. Find the best predicted value of y (weight) given an adult male who is 145 cm tall. Use a 0.01 significance level. The best predicted value of y for an adult male who is 145 cm tall is kg. (Round to two decimal places as needed.)arrow_forwardHeights (cm) and weights (kg) are measured for 100 randomly selected adult males, and range from heights of 139 to 188 cm and weights of 38 to 150 kg. Let the predictor variable x be the first variable given. The 100 paired measurements yield x = 167.62 cm, y = 81.37 kg, r 0.113, P-value = 0.263, and y = - 105+1.01x. Find the best predicted value of y (weight) given an adult male who is 142 cm tall. Use a 0.05 significance level. %3D The best predicted value of y for an adult male who is 142 cm tall is kg. (Round to two decimal places as needed.)arrow_forwardHeights (cm) and weights (kg) are measured for 100 randomly selected adult males, and range from heights of 137 to 192 cm and weights of 40 to 150 kg. Let the predictor variable x be the first variable given. The 100 paired measurements yield x = 167.80 cm, y = 81.45 kg, r=0.211, P-value = 0.035, and y = -103 +1.07x. Find the best predicted value of ŷ (weight) given an adult male who is 145 cm tall. Use a 0.01 significance level. The best predicted value of y for an adult male who is 145 cm tall is (Round to two decimal places as needed.) kg.arrow_forward
- A disk drive has a constant failure rate and an MTTF of 5000 hr. (a) What will the probability of failure be for one year of operation? (b) What will the probability of failure be for one year of operation if two of the drives are placed in active parallel and the failures are independent? (d) What will the probability of failure be for one year of operation if the system si changed to standby model. (e) Describe the effect on the MTTF with a switching failure probability of 0.05. () What would be change in MTTF if the probability of failure of standby unit is 10 percent of the failure of the primary unit in the standby mode?arrow_forwardwhen using delta method to calculate variance, shouldn't [g'(μ)]^2 equal to (θ+1)^4?arrow_forwardHeights (cm) and weights (kg) are measured for 100 randomly selected adult males, and range from heights of 138 to 190 cm and weights of 40 to 150 kg. Let the predictor variable x be the first variable given. The 100 paired measurements yield x = 167.88 cm, y = 81.51 kg, r=0.195, P-value = 0.052, and y= - 105 + 1.05x. Find the best predicted value of y (weight) given an adult male who is 184 cm tall. Use a 0.01 significance level. The best predicted value of y for an adult male who is 184 cm tall is kg. (Round to two decimal places as needed.)arrow_forward
arrow_back_ios
SEE MORE QUESTIONS
arrow_forward_ios
Recommended textbooks for you
- MATLAB: An Introduction with ApplicationsStatisticsISBN:9781119256830Author:Amos GilatPublisher:John Wiley & Sons Inc
 Probability and Statistics for Engineering and th...StatisticsISBN:9781305251809Author:Jay L. DevorePublisher:Cengage Learning
 Statistics for The Behavioral Sciences (MindTap C...StatisticsISBN:9781305504912Author:Frederick J Gravetter, Larry B. WallnauPublisher:Cengage Learning
  Elementary Statistics: Picturing the World (7th E...StatisticsISBN:9780134683416Author:Ron Larson, Betsy FarberPublisher:PEARSON
 The Basic Practice of StatisticsStatisticsISBN:9781319042578Author:David S. Moore, William I. Notz, Michael A. FlignerPublisher:W. H. Freeman
 Introduction to the Practice of StatisticsStatisticsISBN:9781319013387Author:David S. Moore, George P. McCabe, Bruce A. CraigPublisher:W. H. Freeman
MATLAB: An Introduction with Applications
Statistics
ISBN:9781119256830
Author:Amos Gilat
Publisher:John Wiley & Sons Inc
Probability and Statistics for Engineering and th...
Statistics
ISBN:9781305251809
Author:Jay L. Devore
Publisher:Cengage Learning
Statistics for The Behavioral Sciences (MindTap C...
Statistics
ISBN:9781305504912
Author:Frederick J Gravetter, Larry B. Wallnau
Publisher:Cengage Learning
Elementary Statistics: Picturing the World (7th E...
Statistics
ISBN:9780134683416
Author:Ron Larson, Betsy Farber
Publisher:PEARSON
The Basic Practice of Statistics
Statistics
ISBN:9781319042578
Author:David S. Moore, William I. Notz, Michael A. Fligner
Publisher:W. H. Freeman
Introduction to the Practice of Statistics
Statistics
ISBN:9781319013387
Author:David S. Moore, George P. McCabe, Bruce A. Craig
Publisher:W. H. Freeman