MATLAB: An Introduction with Applications
6th Edition
ISBN: 9781119256830
Author: Amos Gilat
Publisher: John Wiley & Sons Inc
expand_more
expand_more
format_list_bulleted
Question

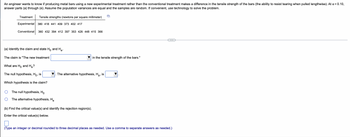
Transcribed Image Text:An engineer wants to know if producing metal bars using a new experimental treatment rather than the conventional treatment makes a difference in the tensile strength of the bars (the ability to resist tearing when pulled lengthwise). At x = 0.10,
answer parts (a) through (e). Assume the population variances are equal and the samples are random. If convenient, use technology to solve the problem.
Treatment
Tensile strengths (newtons per square millimeter)
Experimental 380 418 441 409 373 402 417
Conventional 360 432 394 412 397 353 426 448 415 366
(a) Identify the claim and state Ho and Ha
The claim is "The new treatment
in the tensile strength of the bars."
What are Ho and Ha?
The null hypothesis, Ho, is
Which hypothesis is the claim?
The null hypothesis, Ho
The alternative hypothesis, Ha
(b) Find the critical value(s) and identify the rejection region(s).
Enter the critical value(s) below.
(Type an integer or decimal rounded to three decimal places as needed. Use a comma to separate answers as needed.)
The alternative hypothesis, Ha, is

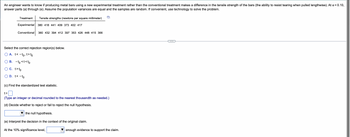
Transcribed Image Text:An engineer wants to know if producing metal bars using a new experimental treatment rather than the conventional treatment makes a difference in the tensile strength of the bars (the ability to resist tearing when pulled lengthwise). At α = 0.10,
answer parts (a) through (e). Assume the population variances are equal and the samples are random. If convenient, use technology to solve the problem.
Treatment
Tensile strengths (newtons per square millimeter)
Experimental 380 418 441 409 373 402 417
Conventional 360 432 394 412 397 353 426 448 415 366
Select the correct rejection region(s) below.
A. t<-
< - to, t> to
B. -to <t<to
C. t>to
D. t< - to
(c) Find the standardized test statistic.
t=
(Type an integer or decimal rounded to the nearest thousandth as needed.)
(d) Decide whether to reject or fail to reject the null hypothesis.
the null hypothesis.
(e) Interpret the decision in the context of the original claim.
At the 10% significance level,
enough evidence to support the claim.
Expert Solution
This question has been solved!
Explore an expertly crafted, step-by-step solution for a thorough understanding of key concepts.
This is a popular solution
Trending nowThis is a popular solution!
Step by stepSolved in 2 steps with 1 images

Knowledge Booster
Similar questions
- A. A patient was given a z score of 2.1 for their bone density exam. The μ = 75 and σ = 8. What is their score (X) for the exam? B. A patient was given an exam score of X = 77. The μ = 75 and σ = 8. What is their z score for the exam?arrow_forwarddo Q1 & Q2 which is shown in imagearrow_forwardi need help please asaparrow_forward
- The slope D of the sample regression line provides a measure of O1.the change in the population value of the dependent variable for every unit change In the Independent varlable. O 2. the change in the population average value of the dependent varlable for overy unit change in the independent varlable, 03.the change In the population value of the independent varlable for every unit change in the dependent varlable. 04.the change in the population average value of the independent variable for every unit change in the dependent varlablo. O 5.the change in the estimated population value of the dependent variable for every unit change in the Independent varlable. O 6.the change in the estimated population average value of the dependent variable for every unit change in the independent varlable. O 7. the change in the estimated population value of the independent variable for every unit change in the dependent variable, O 8. the change in the estimated population average value of the…arrow_forwardElectromagnetic technologies offer effective nondestructive sensing techniques for determining characteristics of pavement. The propagation of electromagnetic waves through the material depends on its dielectric properties. The following data, kindly provided by the authors of the article "Dielectric Modeling of Asphalt Mixtures and Relationship with Density," was used to relate y = dielectric constant to x = air void (%) for 18 samples having 5% asphalt content. x 4.35 4.75 5.57 5.20 5.07 5.79 5.36 6.40 5.66 5.90 6.49 5.70 6.49 6.37 6.51 7.88 6.74 7.14 y 4.55 4.49 4.50 4.47 4.48 4.45 4.40 4.34 4.43 4.43 4.42 4.40 4.35 4.44 4.40 4.26 4.32 4.34 Suppose it had previously been believed that when air void increased by 1 percent, the associated true average change in dielectric constant would be less than -0.064. Does the sample data support this belief? Carry out a test of appropriate hypotheses using a significance level of 0.05. State the appropriate null and alternative…arrow_forwardNormal text Calibri BIUA 10 2 |II 3 I. 4 1) Freeze Inc. is an air conditioning company located in Lakeland, Florida. They collected data for the number of air conditioning units sold in the Central Florida area and for the outside temperature on the day that sales took place. The Sales Manager put the following table together: Outside Temperature Sales (Degrees F) (Number of air conditioning units sold). 68 4 72 78 8 81 10 84 14 86 15 89 21 91 20 93 22 94 25 Plot a scatter diagram for the data provided on the table above and the linear regression line calculated in topic (b). Consider that: Y: number of air conditioning units sold X: outside temperature (degrees F) Guidance: graph should look like the one presented in Figure 4.2 of textbook. Graph plotted by MS Excel, as a result of the Regression function will not be accepted. a) Perform the linear regression calculation and provide the linear regression equation that describes the relationship between Y (number of air conditioning…arrow_forward
- NEED ALL PARTS PLEASE A (continued): null or alternative and what are h0 & ha B. critical values and rejection region (rounded to three decimal places) C. Calculate d and sd D. Find standardized test statistics e. Reject or fail hypothesisarrow_forwardPlease help me with Barrow_forwardA researcher interested in the lobster fishery analyzed a population of lobsters living in shallow waters off a cove in Maine. He measured the length of all the lobsters in the population. The data is shown below. Min 11.4 Table 1: Lengths of Maine Lobsters (cm); (N=2,581) Quartile 1 Q2 (Med) 23.4 41.1 Quartile 3 56.8 Max 71.5 What is true of a lobster that is 56.9 cm in length? O It's bigger than all but one of the lobsters in that area About half the lobsters in the area are bigger, and about half are smaller that that lobster It is bigger than about 25% of the lobsters in that area O About 75% of the lobsters are smaller than that lobsterarrow_forward
arrow_back_ios
arrow_forward_ios
Recommended textbooks for you
 MATLAB: An Introduction with ApplicationsStatisticsISBN:9781119256830Author:Amos GilatPublisher:John Wiley & Sons Inc
 Probability and Statistics for Engineering and th...StatisticsISBN:9781305251809Author:Jay L. DevorePublisher:Cengage Learning
 Statistics for The Behavioral Sciences (MindTap C...StatisticsISBN:9781305504912Author:Frederick J Gravetter, Larry B. WallnauPublisher:Cengage Learning
 Elementary Statistics: Picturing the World (7th E...StatisticsISBN:9780134683416Author:Ron Larson, Betsy FarberPublisher:PEARSON
 The Basic Practice of StatisticsStatisticsISBN:9781319042578Author:David S. Moore, William I. Notz, Michael A. FlignerPublisher:W. H. Freeman
 Introduction to the Practice of StatisticsStatisticsISBN:9781319013387Author:David S. Moore, George P. McCabe, Bruce A. CraigPublisher:W. H. Freeman

MATLAB: An Introduction with Applications
Statistics
ISBN:9781119256830
Author:Amos Gilat
Publisher:John Wiley & Sons Inc

Probability and Statistics for Engineering and th...
Statistics
ISBN:9781305251809
Author:Jay L. Devore
Publisher:Cengage Learning

Statistics for The Behavioral Sciences (MindTap C...
Statistics
ISBN:9781305504912
Author:Frederick J Gravetter, Larry B. Wallnau
Publisher:Cengage Learning

Elementary Statistics: Picturing the World (7th E...
Statistics
ISBN:9780134683416
Author:Ron Larson, Betsy Farber
Publisher:PEARSON

The Basic Practice of Statistics
Statistics
ISBN:9781319042578
Author:David S. Moore, William I. Notz, Michael A. Fligner
Publisher:W. H. Freeman

Introduction to the Practice of Statistics
Statistics
ISBN:9781319013387
Author:David S. Moore, George P. McCabe, Bruce A. Craig
Publisher:W. H. Freeman