
MATLAB: An Introduction with Applications
6th Edition
ISBN: 9781119256830
Author: Amos Gilat
Publisher: John Wiley & Sons Inc
expand_more
expand_more
format_list_bulleted
Related questions
Concept explainers
Question
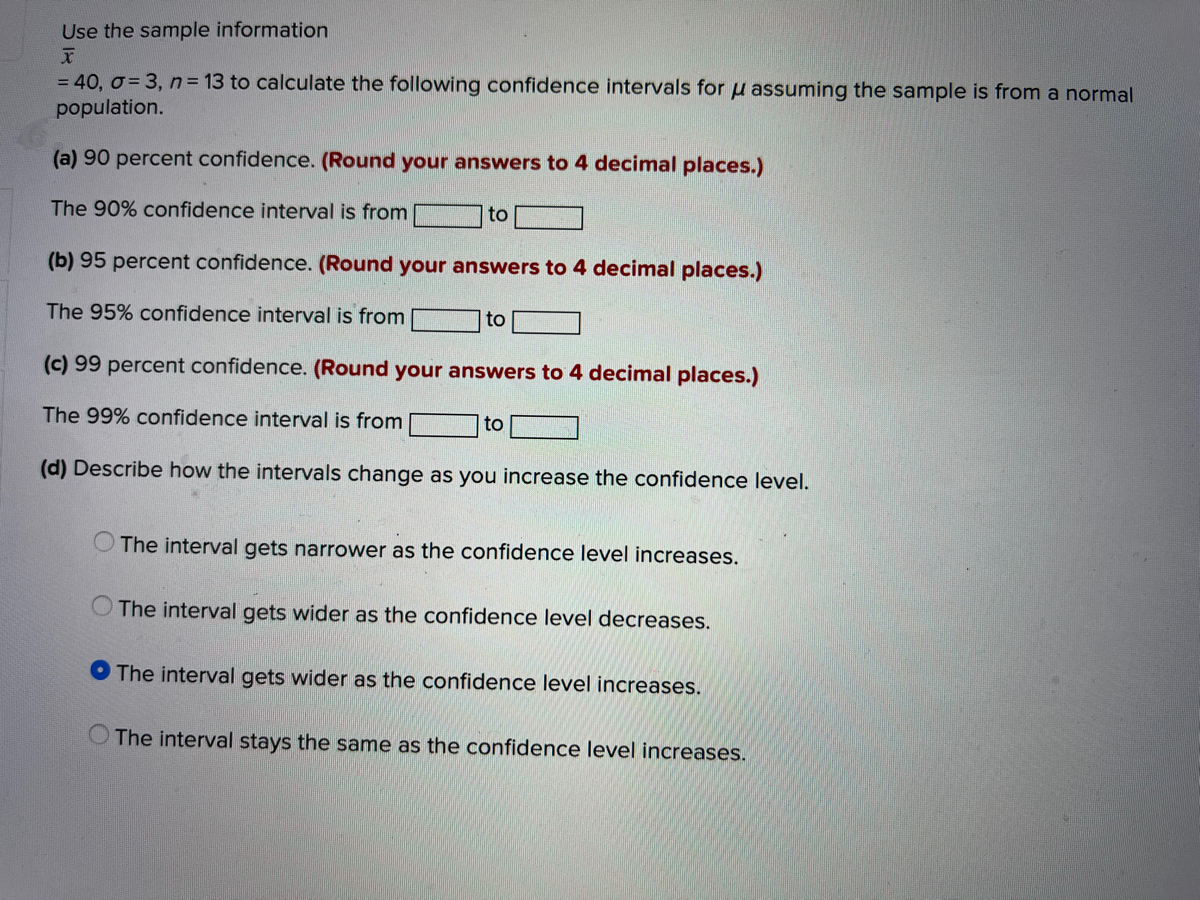

Transcribed Image Text:Use the sample information
= 40, o= 3, n= 13 to calculate the following confidence intervals for u assuming the sample is from a normal
population.
(a) 90 percent confidence. (Round your answers to 4 decimal places.)
The 90% confidence interval is from
to
(b) 95 percent confidence. (Round your answers to 4 decimal places.)
The 95% confidence interval is from
to
(c) 99 percent confidence. (Round your answers to 4 decimal places.)
The 99% confidence interval is from
to
(d) Describe how the intervals change as you increase the confidence level.
The interval gets narrower as the confidence level increases.
The interval gets wider as the confidence level decreases.
O The interval gets wider as the confidence level increases.
The interval stays the same as the confidence level increases.
Expert Solution
This question has been solved!
Explore an expertly crafted, step-by-step solution for a thorough understanding of key concepts.

Step by stepSolved in 2 steps with 1 images

Knowledge Booster


Learn more about
Need a deep-dive on the concept behind this application? Look no further. Learn more about this topic, statistics and related others by exploring similar questions and additional content below.Similar questions
- Use the sample information I= 37, 0 = 5, n= 15 to calculate the following confidence intervals for u assuming the sample is from a normal population. (a) 90 percent confidence. (Round your answers to 4 decimal places.) The 90% confidence interval is from to (b) 95 percent confidence. (Round your answers to 4 decimal places.) The 95% confidence interval is from to (c) 99 percent confidence. (Round your answers to 4 decimal places.) The 99% confidence interval is from to (d) Describe how the intervals change as you increase the confidence level. O The interval gets narrower as the confidence level increases. O The interval gets wider as the confidence level decreases. O The interval gets wider as the confidence level increases. O The interval stays the same as the confidence level increases. |出 NGMt > < Prev 4 of 10 6:5 2/28 ere to searcharrow_forwardUse the sample Information a = 36, o = 6, n= 11 to calculate the following confidence Intervals for u assuming the sample is from a normal population. (a) 90 percent confidence. (Round your answers to 4 decimal places.) The 90% confidence Interval Is from to (b) 95 percent confidence. (Round your answers to 4 decimal places.) The 95% confidence interval is from to (c) 99 percent confidence. (Round your answers to 4 decimal places.) The 99% confidence Interval is from toarrow_forwardTina catches a 14-pound bass. She does not know the population mean or standard deviation. So she takes a sample of five friends and they say the last bass they caught was 9, 12, 13, 10, and 10 pounds. Find the t and calculate a 95% (α = .05) confidence interval.arrow_forward
- We wish to estimate what percent of adult residents in a certain county are parents. Out of 400 adult residents sampled, 356 had kids. Based on this, construct a 95% confidence interval for the proportion, p, of adult residents who are parents in this county.Give your answers as decimals, to three places. ______ < p < _______arrow_forwardIf n = 580 and X = 464, construct a 90% confidence interval for the population proportion, p.Give your answers to three decimals______< p < ______arrow_forwardUse the sample information. X = 40, 0 = 4, and n= 20 to calculate the following confidence intervals assuming the sample is from a normal population. A. 90% confidence from____to____ (Round 4 decimal places.) B. 95% confidence interval is from_____to_____ (Round 4 decimal places.) C. 99% confidence interval is from______to_____ (Round 4 decimal places.) D. Describe how the intervals change as you increase the confidence level. A. The interval gets narrower as the confidence level increases B. The interval gets wider as a confidence level decreases C. The interval gets wider as a confidence level increases D. The interval stays the same as the confidence level increasesarrow_forward
- Use the sample information I= 36, 0 = 4, n= 13 to calculate the following confidence intervals for u assuming the sample is from a normal population. (a) 90 percent confidence. (Round your answers to 4 decimal places.) The 90% confidence interval is from to (b) 95 percent confidence. (Round your answers to 4 decimal places.) The 95% confidence interval is from to (c) 99 percent confidence. (Round your answers to 4 decimal places.) The 99% confidence interval is from to (d) Describe how the intervals change as you increase the confidence level. O The interval gets narrower as the confidence level increases. O The interval gets wider as the confidence level decreases. The interval gets wider as the confidence level increases. O The interval stays the same as the confidence level increases. 3:32 PM 10/25/2020 %23 O e to searcharrow_forwardBeth wants to determine a 99% confidence interval for the true proportion of high school students in the area who attend their home basketball games. How large of a sample must she have to get a margin of error less than 0.04? Assume we have no prior estimate of the proportion and want a conservative choice for the sample size. n =arrow_forwardConstruct a confidence interval for p, - p2 at the given level of confidence. X1 = 35, n, = 254, x2 = 31, n2 = 300, 90% confidence %3D ... The researchers are % confident the difference between the two population proportions, p, - P2, is between and (Use ascending order. Type an integer or decimal rounded to three decimal places as needed.)arrow_forward
- q21- The z value for a 95% confidence interval estimate is: Select one: a. 2.12. b. 1.82. c. 2.00. d. 1.96.arrow_forwardIn a recent poll, 430 people were asked if they liked dogs, and 94% said they did. Find the Margin of Error for this poll, at the 95% confidence level. Give your answer to four decimal places if possible. ______________________arrow_forward
arrow_back_ios
arrow_forward_ios
Recommended textbooks for you
- MATLAB: An Introduction with ApplicationsStatisticsISBN:9781119256830Author:Amos GilatPublisher:John Wiley & Sons Inc
 Probability and Statistics for Engineering and th...StatisticsISBN:9781305251809Author:Jay L. DevorePublisher:Cengage Learning
 Statistics for The Behavioral Sciences (MindTap C...StatisticsISBN:9781305504912Author:Frederick J Gravetter, Larry B. WallnauPublisher:Cengage Learning
  Elementary Statistics: Picturing the World (7th E...StatisticsISBN:9780134683416Author:Ron Larson, Betsy FarberPublisher:PEARSON
 The Basic Practice of StatisticsStatisticsISBN:9781319042578Author:David S. Moore, William I. Notz, Michael A. FlignerPublisher:W. H. Freeman
 Introduction to the Practice of StatisticsStatisticsISBN:9781319013387Author:David S. Moore, George P. McCabe, Bruce A. CraigPublisher:W. H. Freeman
MATLAB: An Introduction with Applications
Statistics
ISBN:9781119256830
Author:Amos Gilat
Publisher:John Wiley & Sons Inc
Probability and Statistics for Engineering and th...
Statistics
ISBN:9781305251809
Author:Jay L. Devore
Publisher:Cengage Learning
Statistics for The Behavioral Sciences (MindTap C...
Statistics
ISBN:9781305504912
Author:Frederick J Gravetter, Larry B. Wallnau
Publisher:Cengage Learning
Elementary Statistics: Picturing the World (7th E...
Statistics
ISBN:9780134683416
Author:Ron Larson, Betsy Farber
Publisher:PEARSON
The Basic Practice of Statistics
Statistics
ISBN:9781319042578
Author:David S. Moore, William I. Notz, Michael A. Fligner
Publisher:W. H. Freeman
Introduction to the Practice of Statistics
Statistics
ISBN:9781319013387
Author:David S. Moore, George P. McCabe, Bruce A. Craig
Publisher:W. H. Freeman