MATLAB: An Introduction with Applications
6th Edition
ISBN: 9781119256830
Author: Amos Gilat
Publisher: John Wiley & Sons Inc
expand_more
expand_more
format_list_bulleted
Question
d. calculate a 95% confidence interval for the population
(__________ , _________)
g. Suppose the
|
|
The midpoint would stay the same and the width would increase |
1- produce the confidence interval mentioned in part g. [Round your answer to 1 decimal place.]
(_____________, ________________)

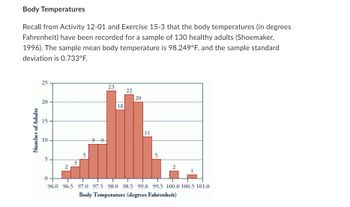
Transcribed Image Text:Body Temperatures
Recall from Activity 12-01 and Exercise 15-3 that the body temperatures (in degrees
Fahrenheit) have been recorded for a sample of 130 healthy adults (Shoemaker,
1996). The sample mean body temperature is 98.249°F, and the sample standard
deviation is 0.733°F.
Number of Adults
25
20
15
10
5-
N
5
3
99
23
18
22
20
-
5
2
0-
96.0 96.5 97.0 97.5 98.0 98.5 99.0 99.5 100.0 100.5 101.0
Body Temperature (degrees Fahrenheit)
Expert Solution
This question has been solved!
Explore an expertly crafted, step-by-step solution for a thorough understanding of key concepts.
Step by stepSolved in 3 steps

Knowledge Booster
Similar questions
- Assume the population is normally distributedarrow_forwardFor the following z scores, please tell me the percentage of scores that lie below it: a. 2.5 ___________ b. -1.45 ___________ c. -1 ____________arrow_forwardWe wish to estimate what percent of adult residents in a certain county are parents. Out of 200 adult residents sampled, 58 had kids. Based on this, construct a 95% confidence interval for the proportion p of adult residents who are parents in this county. Express your answer in tri-inequality form. Give your answers as decimals, to three places. __________< p <_________ Express the same answer using the point estimate and margin of error. Give your answers as decimals, to three places. p = _______ ± ___________arrow_forward
- In the US, 46.2% of all people have type O blood, 39.1% have type A blood, 10.4% have type B blood and 4.3% have type AB blood. A researcher wants to see if the distribution of blood type is different for millionaires. The table below shows the results of a random sample of 3116 millionaires. What can be concluded at the a = 0.01 significance level? a. Complete the table by filling in the expected frequencies. Round to the nearest whole number: Frequencies of Blood Type Outcome Frequency Expected Frequency 1434 A 1224 В 310 AB 148 b. What is the correct statistical test to use? Select an answer V c. What are the null and alternative hypotheses? Но: O Blood type and income are independent. O The distribution of blood type for millionaires is not the same as it is for Americans in general. O The distribution of blood type for millionaires is the same as it is for Americans in general. O Blood type and income are dependent.arrow_forward#30arrow_forwardWhich of the following statements is not true? There is only one median for each variable. One definition of the median states that, for an odd number of observations, the median is the middle score when scores are placed in order of magnitude. Another term for the median is 50th percentile. The median is generally more sensitive to (i.e., affected by) the presence of a few extreme observations than is the mean.arrow_forward
- of 1 For the following situation, find the mean and standard deviation of the population. List all samples (with replacement) of the given size from that population and find the mean of each. Find the mean and standard deviation of the sampling distribution and compare them with the mean and standard deviation of the population. The word counts of five essays are 508, 634, 545, 611, and 577. Use a sample size of 2. D The mean of the population is 575 (Round to two decimal places as needed.) The standard deviation of the population is . (Round to two decimal places as needed.) Get more help - Clear all Check answer Qarrow_forwardAnswer #1 and 2.arrow_forward17arrow_forward
- If n=25, ¯xx¯(x-bar)=47, and s=3, find the margin of error at a 80% confidence levelGive your answer to two decimal places. ________________arrow_forwardIf n=19, ¯x(x-bar)=34, and s=12, construct a confidence interval at a 95% confidence level. Assume the data came from a normally distributed population.Give your answers to one decimal place. ________________< μ <_____________________arrow_forwardIf n=400 and X=80, construct a 90% confidence interval estimate for the population proportion. ______≤π≤_____ (Round to four decimal places as neededarrow_forward
arrow_back_ios
SEE MORE QUESTIONS
arrow_forward_ios
Recommended textbooks for you
 MATLAB: An Introduction with ApplicationsStatisticsISBN:9781119256830Author:Amos GilatPublisher:John Wiley & Sons Inc
 Probability and Statistics for Engineering and th...StatisticsISBN:9781305251809Author:Jay L. DevorePublisher:Cengage Learning
 Statistics for The Behavioral Sciences (MindTap C...StatisticsISBN:9781305504912Author:Frederick J Gravetter, Larry B. WallnauPublisher:Cengage Learning
 Elementary Statistics: Picturing the World (7th E...StatisticsISBN:9780134683416Author:Ron Larson, Betsy FarberPublisher:PEARSON
 The Basic Practice of StatisticsStatisticsISBN:9781319042578Author:David S. Moore, William I. Notz, Michael A. FlignerPublisher:W. H. Freeman
 Introduction to the Practice of StatisticsStatisticsISBN:9781319013387Author:David S. Moore, George P. McCabe, Bruce A. CraigPublisher:W. H. Freeman

MATLAB: An Introduction with Applications
Statistics
ISBN:9781119256830
Author:Amos Gilat
Publisher:John Wiley & Sons Inc

Probability and Statistics for Engineering and th...
Statistics
ISBN:9781305251809
Author:Jay L. Devore
Publisher:Cengage Learning

Statistics for The Behavioral Sciences (MindTap C...
Statistics
ISBN:9781305504912
Author:Frederick J Gravetter, Larry B. Wallnau
Publisher:Cengage Learning

Elementary Statistics: Picturing the World (7th E...
Statistics
ISBN:9780134683416
Author:Ron Larson, Betsy Farber
Publisher:PEARSON

The Basic Practice of Statistics
Statistics
ISBN:9781319042578
Author:David S. Moore, William I. Notz, Michael A. Fligner
Publisher:W. H. Freeman

Introduction to the Practice of Statistics
Statistics
ISBN:9781319013387
Author:David S. Moore, George P. McCabe, Bruce A. Craig
Publisher:W. H. Freeman