
MATLAB: An Introduction with Applications
6th Edition
ISBN: 9781119256830
Author: Amos Gilat
Publisher: John Wiley & Sons Inc
expand_more
expand_more
format_list_bulleted
Related questions
Question
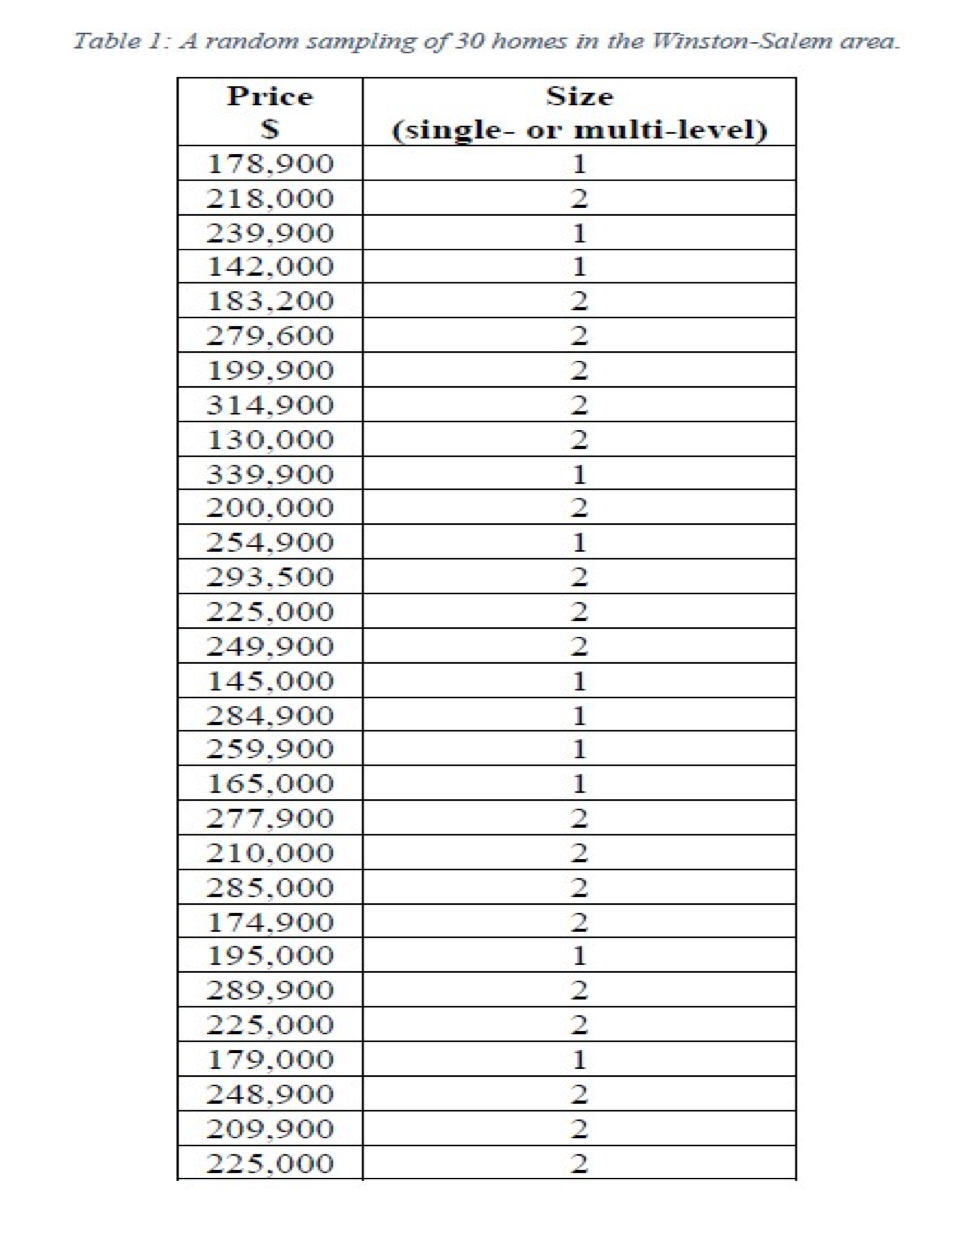

Transcribed Image Text:Table 1: A random sampling of 30 homes in the Winston-Salem area.
Price
Size
(single- or multi-level)
178,900
1
218,000
239,900
1
142,000
1
183,200
279,600
199,900
2
2
314,900
130,000
2
339,900
200,000
254,900
293,500
1
2
1
2
225,000
2
249,900
2
145,000
1
284,900
259,900
1
1
165,000
277,900
210,000
1
2
285,000
174,900
195,000
1
289,900
2
225,000
2
179,000
248,900
1
2
209,900
2
225,000

Transcribed Image Text:Use the sample data to construct the following statements filling in the blanks with the answers you
calculate
A. Use the sample data to construct a 95% confidence interval for the mean price of a home in
Winston-Salem. Since CL = 95%, a = 0.05. Determine the t-score associated with this CL
and use it to determine the error bound of the population mean (EBM). Finally, construct a
statement in the context of the problem that explains your result. (Use the following statement
as a template and fill in the blanks with your results.)
"We believe, at the
Winston-Salem lies between $
% confidence level, that the true population mean of home prices in
and $
B. Use the "plus four" method to estimate the 95% confidence interval for the population
proportion of single-floor homes in the area. Remember, you must calculate p', q',
and 20.025 in order to determine your error bound of the population proportion (EBP). Write
a sentence that interprets the estimate in the context of the situation in the problem. Include the
confidence level and confidence interval. (Use the statement below as a template.)
"We believe, at the_% confidence level, that the true population proportion of single-floor
% and
homes in Winston-Salem lies between
%."
2.
Expert Solution
This question has been solved!
Explore an expertly crafted, step-by-step solution for a thorough understanding of key concepts.

Step by stepSolved in 4 steps

Knowledge Booster

Similar questions
- You are estimating how much population A's proportion of answering yes to a question exceeds population B's proportion who say yes to the same question by using a confidence interval. You have some ability to control the width of your interval. Which of the following would be most likely to ensure that the confidence interval is narrowed? O a. You increase both sample sizes and you decrease your confidence level. O b. You increase both sample sizes and you increase your confidence level. OC. You decrease both sample sizes and you increase your confidence level. O d. You decrease both sample sizes and you decrease your confidence level.arrow_forwardSome of the following questions might be more challenging, but we want you to wrestle through them and ask for clarification along the way. We hope that, ultimately, working through these problems will strengthen your understanding of the big ideas behind confidence intervals.12. What proportion of college students pursue academic minors? To estimate this unknownpopulation proportion, a researcher gathers a random sample of data and constructs a95% confidence interval. The interval ends up being from 0.46 to 0.62. From thisinformation, we know the sample proportion must be ____________ and the margin oferror must be ______________.arrow_forwardNeed to solve for 95% interval and 90% intervalarrow_forward
- I think the answer to this last part is Carrow_forwardExplain also how you use Z table ..arrow_forwardAnswer each question and justify all work for full You will need your z and t charts for this quiz. 1. Death penalty: A group claims that the overall feelings of the general population on the . death penalty is changing. 643 people were interviewed, and of them, 258 believed in using the death penalty. Construct a 95% confidence interval for the proportion of people that believe in the death penalty. Follow the steps below: What is the best point estimate for the proportion of people who believe in the death penalty? › (round to two decimal places)arrow_forward
- View both photos attached and answer the question below. Estimate the net sale in future promotions, 95% confidence intervals for the population means were constructed. See output below. Explain and compare the confidence interval for net sales for Promotional and Regular customers. Make sure to clearly describe the confidence intervals in the context of the problem.arrow_forwardUse the histogram below to build a 95% confidence interval of the average heart rate of a person. Put your two numbers below in the spaces provided. Round to one decimal: ex: 98.2 The histogram visualizes the results of doing one thousand studies just like above. We are 95% confident that the average heart rate of a person is between ____and_____ All information needed to answer this problem is present. There is no missing information to this question.arrow_forwardPlease answer all questions in detailarrow_forward
arrow_back_ios
arrow_forward_ios
Recommended textbooks for you
- MATLAB: An Introduction with ApplicationsStatisticsISBN:9781119256830Author:Amos GilatPublisher:John Wiley & Sons Inc
 Probability and Statistics for Engineering and th...StatisticsISBN:9781305251809Author:Jay L. DevorePublisher:Cengage Learning
 Statistics for The Behavioral Sciences (MindTap C...StatisticsISBN:9781305504912Author:Frederick J Gravetter, Larry B. WallnauPublisher:Cengage Learning
  Elementary Statistics: Picturing the World (7th E...StatisticsISBN:9780134683416Author:Ron Larson, Betsy FarberPublisher:PEARSON
 The Basic Practice of StatisticsStatisticsISBN:9781319042578Author:David S. Moore, William I. Notz, Michael A. FlignerPublisher:W. H. Freeman
 Introduction to the Practice of StatisticsStatisticsISBN:9781319013387Author:David S. Moore, George P. McCabe, Bruce A. CraigPublisher:W. H. Freeman
MATLAB: An Introduction with Applications
Statistics
ISBN:9781119256830
Author:Amos Gilat
Publisher:John Wiley & Sons Inc
Probability and Statistics for Engineering and th...
Statistics
ISBN:9781305251809
Author:Jay L. Devore
Publisher:Cengage Learning
Statistics for The Behavioral Sciences (MindTap C...
Statistics
ISBN:9781305504912
Author:Frederick J Gravetter, Larry B. Wallnau
Publisher:Cengage Learning
Elementary Statistics: Picturing the World (7th E...
Statistics
ISBN:9780134683416
Author:Ron Larson, Betsy Farber
Publisher:PEARSON
The Basic Practice of Statistics
Statistics
ISBN:9781319042578
Author:David S. Moore, William I. Notz, Michael A. Fligner
Publisher:W. H. Freeman
Introduction to the Practice of Statistics
Statistics
ISBN:9781319013387
Author:David S. Moore, George P. McCabe, Bruce A. Craig
Publisher:W. H. Freeman