MATLAB: An Introduction with Applications
6th Edition
ISBN: 9781119256830
Author: Amos Gilat
Publisher: John Wiley & Sons Inc
expand_more
expand_more
format_list_bulleted
Question

Transcribed Image Text:### Understanding Confidence Intervals
#### Explanation
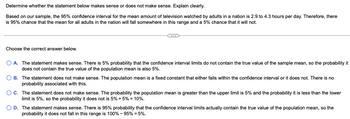
Determine whether the statement below makes sense or does not make sense. Explain clearly.
**Statement:**
Based on our sample, the 95% confidence interval for the mean amount of television watched by adults in a nation is 2.9 to 4.3 hours per day. Therefore, there is a 95% chance that the mean for all adults in the nation will fall somewhere in this range and a 5% chance that it will not.
---
#### Multiple Choice Question
Choose the correct answer below.
**A.** The statement makes sense. There is a 5% probability that the confidence interval limits do not contain the true value of the sample mean, so the probability it does not contain the true value of the population mean is also 5%.
**B.** The statement does not make sense. The population mean is a fixed constant that either falls within the confidence interval or it does not. There is no probability associated with this.
**C.** The statement does not make sense. The probability the population mean is greater than the upper limit is 5% and the probability it is less than the lower limit is 5%, so the probability it does not is 5% + 5% = 10%.
**D.** The statement makes sense. There is 95% probability that the confidence interval limits actually contain the true value of the population mean, so the probability it does not fall in this range is 100% − 95% = 5%.
---
#### Analysis
A confidence interval, in this context, gives a range derived from sample data within which we are *95% certain* that the true population mean lies. This does not imply a probabilistic measure as applicable to the truth of mean if viewed as fixed but rather on the method’s efficacy over repeated sampling.
**Correct Answer:**
**B.** The statement does not make sense. The population mean is a fixed constant that either falls within the confidence interval or it does not. There is no probability associated with this.
Understanding confidence intervals is crucial in statistics, signifying through numerous samples, 95% will contain the true population mean, underpinning methodological reliability without assigning probability to specific interval outcomes.
Expert Solution
This question has been solved!
Explore an expertly crafted, step-by-step solution for a thorough understanding of key concepts.
This is a popular solution
Trending nowThis is a popular solution!
Step by stepSolved in 2 steps

Knowledge Booster
Similar questions
- Please show workarrow_forwardPlease make sure answers are clear n easy to read. Please do it on white paper. Again make sure the answer is clear.arrow_forwardDetermine whether the statement makes sense or does not make sense, and explain your reasoning. Saying "Ha!" is an exclamation and not a statement. Choose the correct answer below. O A. This makes sense. In logic, the concern is not solely with statements, and not all English sentences are statements. This does not make sense. In logic, the concern is solely with statements, and all English sentences are statements. This makes sense. An exclamation is not a statement because it is not either true or false. O B. O C. O D. This does not make sense. If a person says something to another person, then that person has made a statement.arrow_forward
- Determine whether the following statement is true or false. The product of two negative real numbers is positive. Choose the correct answer below. O A. True, because the product of two real numbers is always positive. O B. False, because the product of two negative real numbers is zero. O C. False, because the product of two negative real numbers is negative. O D. True, because the product of two real numbers with the same sign is always positive.arrow_forwardSimplify. 12 7 50tu Assume that all variables repre.arrow_forwardSafari File Edit View History Bookmarks Window Help sdsu.instructure.com Be Quiz: Midterm #2 Rich LT Is the statement a + b = |a| - |b| always uue, sometimes true, or never true? It is sometimes true. It is always true. It is never true.arrow_forward
arrow_back_ios
arrow_forward_ios
Recommended textbooks for you
 MATLAB: An Introduction with ApplicationsStatisticsISBN:9781119256830Author:Amos GilatPublisher:John Wiley & Sons Inc
 Probability and Statistics for Engineering and th...StatisticsISBN:9781305251809Author:Jay L. DevorePublisher:Cengage Learning
 Statistics for The Behavioral Sciences (MindTap C...StatisticsISBN:9781305504912Author:Frederick J Gravetter, Larry B. WallnauPublisher:Cengage Learning
 Elementary Statistics: Picturing the World (7th E...StatisticsISBN:9780134683416Author:Ron Larson, Betsy FarberPublisher:PEARSON
 The Basic Practice of StatisticsStatisticsISBN:9781319042578Author:David S. Moore, William I. Notz, Michael A. FlignerPublisher:W. H. Freeman
 Introduction to the Practice of StatisticsStatisticsISBN:9781319013387Author:David S. Moore, George P. McCabe, Bruce A. CraigPublisher:W. H. Freeman

MATLAB: An Introduction with Applications
Statistics
ISBN:9781119256830
Author:Amos Gilat
Publisher:John Wiley & Sons Inc

Probability and Statistics for Engineering and th...
Statistics
ISBN:9781305251809
Author:Jay L. Devore
Publisher:Cengage Learning

Statistics for The Behavioral Sciences (MindTap C...
Statistics
ISBN:9781305504912
Author:Frederick J Gravetter, Larry B. Wallnau
Publisher:Cengage Learning

Elementary Statistics: Picturing the World (7th E...
Statistics
ISBN:9780134683416
Author:Ron Larson, Betsy Farber
Publisher:PEARSON

The Basic Practice of Statistics
Statistics
ISBN:9781319042578
Author:David S. Moore, William I. Notz, Michael A. Fligner
Publisher:W. H. Freeman

Introduction to the Practice of Statistics
Statistics
ISBN:9781319013387
Author:David S. Moore, George P. McCabe, Bruce A. Craig
Publisher:W. H. Freeman