
MATLAB: An Introduction with Applications
6th Edition
ISBN: 9781119256830
Author: Amos Gilat
Publisher: John Wiley & Sons Inc
expand_more
expand_more
format_list_bulleted
Related questions
Concept explainers
Topic Video
Question

Transcribed Image Text:### Confidence Intervals for Proportions
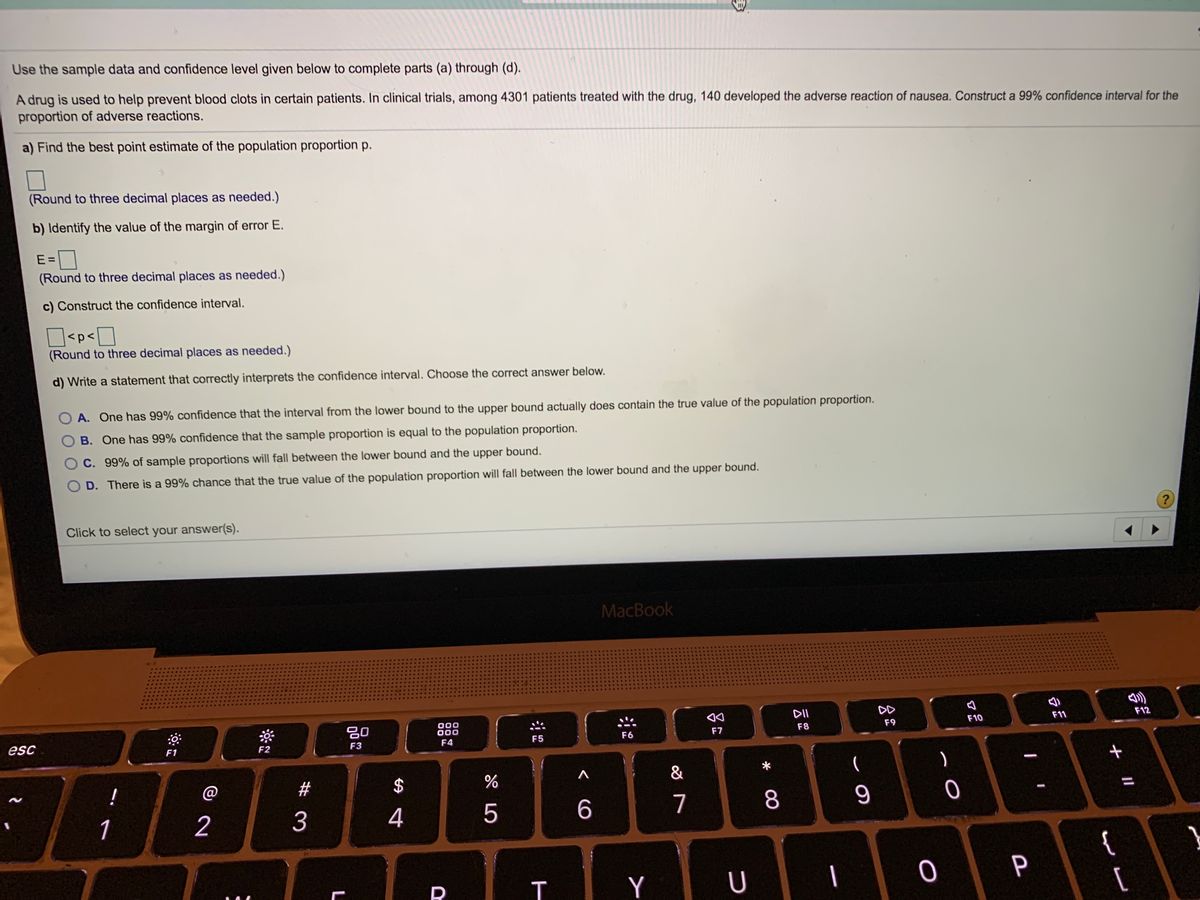
Use the sample data and confidence level given below to complete parts (a) through (d).
A drug is used to help prevent blood clots in certain patients. In clinical trials, among 4301 patients treated with the drug, 140 developed the adverse reaction of nausea. Construct a 99% confidence interval for the proportion of adverse reactions.
#### Steps:
1. **Find the best point estimate of the population proportion p.**
- (Round to three decimal places as needed.)
2. **Identify the value of the margin of error E.**
- E =
- (Round to three decimal places as needed.)
3. **Construct the confidence interval.**
- < \( p \) <
- (Round to three decimal places as needed.)
4. **Write a statement that correctly interprets the confidence interval. Choose the correct answer below.**
- A. One has 99% confidence that the interval from the lower bound to the upper bound actually does contain the true value of the population proportion.
- B. One has 99% confidence that the sample proportion is equal to the population proportion.
- C. 99% of sample proportions will fall between the lower bound and the upper bound.
- D. There is a 99% chance that the true value of the population proportion will fall between the lower bound and the upper bound.
Click to select your answer(s).
#### Note
- Be sure to perform appropriate rounding where indicated (to three decimal places).
- Ensure the accuracy of calculated values for meaningful interpretation of results.
---
This content was designed to assist students in understanding the process of constructing and interpreting confidence intervals for proportions, a key concept in statistics and inferential analysis. The example used focuses on a clinical trial scenario, providing practical application of the statistical methods discussed.
Expert Solution
This question has been solved!
Explore an expertly crafted, step-by-step solution for a thorough understanding of key concepts.

This is a popular solution

Trending nowThis is a popular solution!

Step by stepSolved in 3 steps with 3 images

Knowledge Booster


Learn more about
Need a deep-dive on the concept behind this application? Look no further. Learn more about this topic, statistics and related others by exploring similar questions and additional content below.Similar questions
- Consider a sample data with x=25 and s=2. Compute a chebyshev’s interval for which at least 89% of the data will lie?arrow_forwardA sample of n = 200 college students are asked if they believe in extraterrestrial life and 120 of these students say that they do. The data are used to test if more than half of college students believe in extraterrestrial life. d. Find a 95% confidence interval e. Write a conclusion for the confidence intervalarrow_forwardJse the sample data and confidence level given below to complete parts (a) through (d). A drug is used to help prevent blood clots in cértain patients. In clinical trials, among 4334 patients treated with the drug, 12 developed the adverse reaction of nausea. Construct a 95% confidence interval for the proportion of adverse reactions. a) Find the best point estimate of the population proportion p. (Round to three decimal places as needed.) b) Identify the value of the margin of error E. E =arrow_forward
- This Quiz: 10 pts possi Use the sample data and confidence level given below to complete parts (a) through (d). A drug is used to help prevent blood clots in certain patients. In clinical trials, among 4549 patients treated with the drug, 123 developed the adverse reaction of nausea. Construct a 99% confidence interval for the proportion of adverse reactions. a) Find the best point estimate of the population proportion p. (Round to three decimal places as needed.) b) Identify the value of the margin of error E. E= (Round to three decimal places as needed.) c) Construct the confidence interval.arrow_forwardA developmental psychologist believes that children’s self-esteem scores change with age. She measures N=8 children’s self-esteem in 3rd grade and again in 6th. Evaluate the results of her data using α = .052tail. **Attached Image** a. Show how the 95% confidence interval was calculated. b. State the conclusion in APA format. c. What is Cohen’s d?arrow_forwardUse the sample data and confidence level given below to complete parts (a) through (d). A research institute poll asked respondents if they felt vulnerable to identity theft. In the poll, n= 1004 and x = 575 who said "yes." Use a 90% confidence level. E Click the icon to view a table of z scores. .... a) Find the best point estimate of the population proportion p. (Round to three decimal places as needed.)arrow_forward
- Answer each question and justify all work for full You will need your z and t charts for this quiz. 1. Death penalty: A group claims that the overall feelings of the general population on the . death penalty is changing. 643 people were interviewed, and of them, 258 believed in using the death penalty. Construct a 95% confidence interval for the proportion of people that believe in the death penalty. Follow the steps below: What is the best point estimate for the proportion of people who believe in the death penalty? › (round to two decimal places)arrow_forwardResearchers studied the mean egg length (in millimeters) for a bird population. After taking a random sample of eggs, they obtained a 95% confidence interval of (45,60). What is the value of the margin of error? Choose the correct answer below. A. 15 mm B. 52.5 mm O c. 7.5 mm O D. 1.96arrow_forwardA poll was conducted that asked 1015 people how many books they had read in the past year. Results indicated that x= 14.3 books and s= 16.6 books. Construct a 90% confidence interval for the mean number of books people read. E Click the icon to view the table of areas under the t-distribution, Construct a 90% confidence interval for the mean number of books people read. ) (Use ascending order. Round to two decimal places as needed.)arrow_forward
arrow_back_ios
arrow_forward_ios
Recommended textbooks for you
- MATLAB: An Introduction with ApplicationsStatisticsISBN:9781119256830Author:Amos GilatPublisher:John Wiley & Sons Inc
 Probability and Statistics for Engineering and th...StatisticsISBN:9781305251809Author:Jay L. DevorePublisher:Cengage Learning
 Statistics for The Behavioral Sciences (MindTap C...StatisticsISBN:9781305504912Author:Frederick J Gravetter, Larry B. WallnauPublisher:Cengage Learning
  Elementary Statistics: Picturing the World (7th E...StatisticsISBN:9780134683416Author:Ron Larson, Betsy FarberPublisher:PEARSON
 The Basic Practice of StatisticsStatisticsISBN:9781319042578Author:David S. Moore, William I. Notz, Michael A. FlignerPublisher:W. H. Freeman
 Introduction to the Practice of StatisticsStatisticsISBN:9781319013387Author:David S. Moore, George P. McCabe, Bruce A. CraigPublisher:W. H. Freeman
MATLAB: An Introduction with Applications
Statistics
ISBN:9781119256830
Author:Amos Gilat
Publisher:John Wiley & Sons Inc
Probability and Statistics for Engineering and th...
Statistics
ISBN:9781305251809
Author:Jay L. Devore
Publisher:Cengage Learning
Statistics for The Behavioral Sciences (MindTap C...
Statistics
ISBN:9781305504912
Author:Frederick J Gravetter, Larry B. Wallnau
Publisher:Cengage Learning
Elementary Statistics: Picturing the World (7th E...
Statistics
ISBN:9780134683416
Author:Ron Larson, Betsy Farber
Publisher:PEARSON
The Basic Practice of Statistics
Statistics
ISBN:9781319042578
Author:David S. Moore, William I. Notz, Michael A. Fligner
Publisher:W. H. Freeman
Introduction to the Practice of Statistics
Statistics
ISBN:9781319013387
Author:David S. Moore, George P. McCabe, Bruce A. Craig
Publisher:W. H. Freeman