
MATLAB: An Introduction with Applications
6th Edition
ISBN: 9781119256830
Author: Amos Gilat
Publisher: John Wiley & Sons Inc
expand_more
expand_more
format_list_bulleted
Related questions
Question
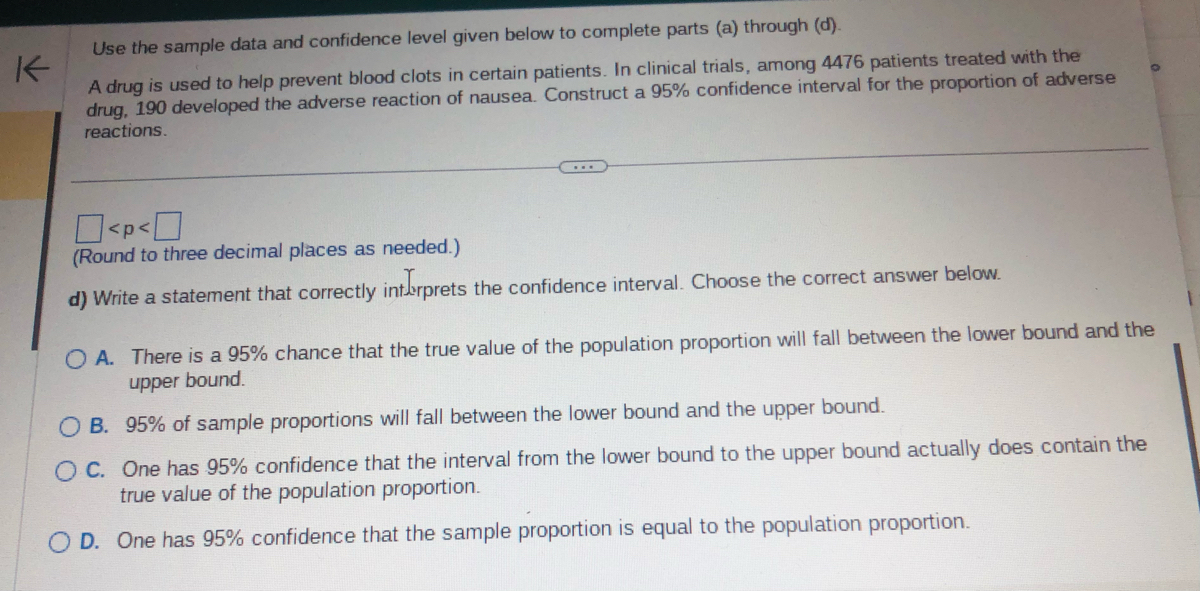

Transcribed Image Text:Use the sample data and confidence level given below to complete parts (a) through (d).
K
A drug is used to help prevent blood clots in certain patients. In clinical trials, among 4476 patients treated with the
drug, 190 developed the adverse reaction of nausea. Construct a 95% confidence interval for the proportion of adverse
reactions.
(Round to three decimal places as needed.)
d) Write a statement that correctly interprets the confidence interval. Choose the correct answer below.
OA. There is a 95% chance that the true value of the population proportion will fall between the lower bound and the
upper bound.
OB. 95% of sample proportions will fall between the lower bound and the upper bound.
OC. One has 95% confidence that the interval from the lower bound to the upper bound actually does contain the
true value of the population proportion.
OD. One has 95% confidence that the sample proportion is equal to the population proportion.

Transcribed Image Text:Use the sample data and confidence level given below to complete parts (a) through (d).
K
A drug is used to help prevent blood clots in certain patients. In clinical trials, among 4476 patients treated with the
drug, 190 developed the adverse reaction of nausea. Construct a 95% confidence interval for the proportion of adverse
reactions.
a) Find the best point estimate of the population proportion p.
(Round to three decimal places as needed.)
b) Identify the value of the margin of error E.
E=
(Round to three decimal places as needed.)
c) Construct the confidence interval.
<p<
(Round to three decimal places as needed.)
Expert Solution
This question has been solved!
Explore an expertly crafted, step-by-step solution for a thorough understanding of key concepts.

This is a popular solution

Trending nowThis is a popular solution!

Step by stepSolved in 6 steps with 16 images

Knowledge Booster

Similar questions
- Please help!arrow_forwardIn a study of government financial aid for college students, it becomes necessary to estimate the percentage of full-time college students who earn a bachelor's degree in four years or less. Find the sample size needed to estimate that percentage. Use a 0.05 margin of error and use a confidence level of 99%. Complete parts (a) through (c) below.arrow_forwardConsider full-time community college students as an observational unit. a) Come up with one categorical and one quantitative variable related to a full-time community college student. [You CANNOT use AGE, HEIGHT, GENDER, MAJOR]. b) Considering your categorical variable from part a), name three types of graphical displays you can use to represent that variable. c) Come up with one quantitative variable for a community college student that would have a distribution that is SKEWED RIGHT or SKEWED LEFT.arrow_forward
- According to recent data by the American Marketing Association, 76.5%of people in the 18-24 age group used social media in 2017. You want to find out what the social media proportion is among your classmates who are all between 18 and 24 years old. Suppose you obtain a random sample of 229 students and find that 202 students in this sample are active social media users. Complete parts a through c below. a. Construct a 99% confidence interval to estimate the actual proportion of social media users. A 99% confidence interval to estimate the actual proportion has a lower limit of------ and an upper limit of------- (Round to three decimal places as needed.) b. What is the margin of error for this sample? c. Is there evidence that this proportion matches that of the overall population based on the sample?arrow_forwardThe table below shows the distribution of weight of a certain type of fruit. weight frequency <10 4 <15 3 <20 23 <25 54 <30 16 <35 9 <40 7 <45 4 1) Draw the histogram of the data and use it to estimate the model weight. 2) calculate mean, median and interquartile range.arrow_forwardf.arrow_forward
arrow_back_ios
arrow_forward_ios
Recommended textbooks for you
- MATLAB: An Introduction with ApplicationsStatisticsISBN:9781119256830Author:Amos GilatPublisher:John Wiley & Sons Inc
 Probability and Statistics for Engineering and th...StatisticsISBN:9781305251809Author:Jay L. DevorePublisher:Cengage Learning
 Statistics for The Behavioral Sciences (MindTap C...StatisticsISBN:9781305504912Author:Frederick J Gravetter, Larry B. WallnauPublisher:Cengage Learning
  Elementary Statistics: Picturing the World (7th E...StatisticsISBN:9780134683416Author:Ron Larson, Betsy FarberPublisher:PEARSON
 The Basic Practice of StatisticsStatisticsISBN:9781319042578Author:David S. Moore, William I. Notz, Michael A. FlignerPublisher:W. H. Freeman
 Introduction to the Practice of StatisticsStatisticsISBN:9781319013387Author:David S. Moore, George P. McCabe, Bruce A. CraigPublisher:W. H. Freeman
MATLAB: An Introduction with Applications
Statistics
ISBN:9781119256830
Author:Amos Gilat
Publisher:John Wiley & Sons Inc
Probability and Statistics for Engineering and th...
Statistics
ISBN:9781305251809
Author:Jay L. Devore
Publisher:Cengage Learning
Statistics for The Behavioral Sciences (MindTap C...
Statistics
ISBN:9781305504912
Author:Frederick J Gravetter, Larry B. Wallnau
Publisher:Cengage Learning
Elementary Statistics: Picturing the World (7th E...
Statistics
ISBN:9780134683416
Author:Ron Larson, Betsy Farber
Publisher:PEARSON
The Basic Practice of Statistics
Statistics
ISBN:9781319042578
Author:David S. Moore, William I. Notz, Michael A. Fligner
Publisher:W. H. Freeman
Introduction to the Practice of Statistics
Statistics
ISBN:9781319013387
Author:David S. Moore, George P. McCabe, Bruce A. Craig
Publisher:W. H. Freeman