
MATLAB: An Introduction with Applications
6th Edition
ISBN: 9781119256830
Author: Amos Gilat
Publisher: John Wiley & Sons Inc
expand_more
expand_more
format_list_bulleted
Related questions
Question
What is the P value
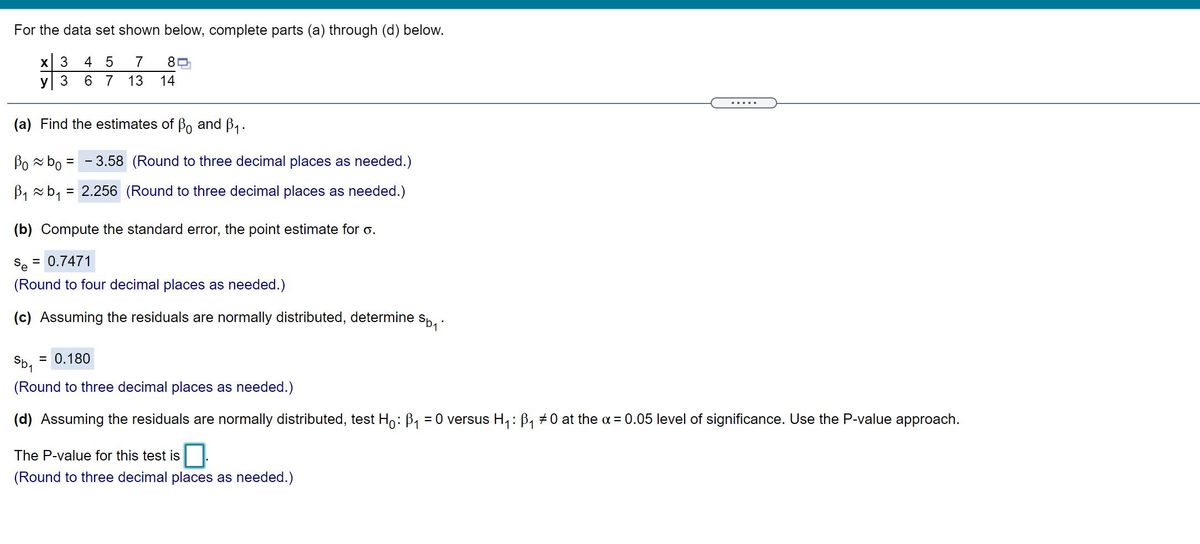

Transcribed Image Text:For the data set shown below, complete parts (a) through (d) below.
X 3
y 3
6 7
4 5
7
13
14
.....
(a) Find the estimates of B, and B,.
Po bo =
- 3.58 (Round to three decimal places as needed.)
B1 xb,
= 2.256 (Round to three decimal places as needed.)
(b) Compute the standard error, the point estimate for o.
Se = 0.7471
(Round to four decimal places as needed.)
(c) Assuming the residuals are normally distributed, determine sp.
= 0.180
(Round to three decimal places as needed.)
(d) Assuming the residuals are normally distributed, test Ho: B, = 0 versus H,: B, +0 at the a = 0.05 level of significance. Use the P-value approach.
The P-value for this test is
(Round to three decimal places as needed.)
Expert Solution
This question has been solved!
Explore an expertly crafted, step-by-step solution for a thorough understanding of key concepts.

This is a popular solution

Trending nowThis is a popular solution!

Step by stepSolved in 2 steps with 1 images

Knowledge Booster

Similar questions
- Can you please help me figure out the Z and P value. I can do the multiple choice on my own. Also, if you can please make it clear what the answers are that would be great often things are left vauge and I dont know which is the answer. Thank you for your help.arrow_forwardMatch these values of r with the accompanying scatterplots: 1, - 0.996, - 0.743, 0.996, and 0.358. Click the icon to view the scatterplots. i Scatterplots Match the values of r to the scatterplots. Scatterplot 1, r = Scatterplot 2, r = Scatterplot 1 Scatterplot 2 Scatterplot 3 Scatterplot 3, r = 15- 0- 8- . Scatterplot 4, r= 14- -2- 6- 13- Scatterplot 5, r= -4- 4- 12- -6– 11- 2- -8- 1 104 0- 0.2 0.4 0.6 0.8 1 0.2 0.4 0.6 0.8 1 0.2 0.4 0.6 0.8 1 - 0.743 0.996 Scatterplot 4 Scatterplot 5 - 0.996 8- 8- 0.358 6- 6- > 4- 4- 2- 2- 0+ 0- 0.2 0.4 0.6 0.8 1 0.2 0.4 0.6 0.8 1arrow_forwardThe 2004 General Social Survey asked a random sample of 977 adult Americans how often they feel rushed, with three options to choose from: always, sometimes, and never. The sample result was that 304 of the 977 people responded "always." Calculate the p value (four decimals)arrow_forward
- See picture for problem.arrow_forwardMatch these values of r with the accompanying scatterplots: 0.465, - 0.465, - 0.797, 1, and 0.797. Click the icon to view the scatterplots. Match the values of r to the scatterplots. Scatterplot 1, r= Scatterplots Scatterplot 2, r= Scatterplot 3, r= Scatterplot 4, r Scatterplot 1 Scatterplot 2 Scat Scatterplot 5, r= 8- 15- 14- 6- 6- 13- >4. 12 2- 2- 11- O 02 04 o's o8 i 04 6 02 04 os o'8 10 0.2 o4 Satterplot 4 Scatterplot 5 8- 6- >4. 2- 6 02 o4 o's o's 04 o o2 04 o's o's Print Done of ofarrow_forwardHow would I identify the p-value?arrow_forward
arrow_back_ios
arrow_forward_ios
Recommended textbooks for you
- MATLAB: An Introduction with ApplicationsStatisticsISBN:9781119256830Author:Amos GilatPublisher:John Wiley & Sons Inc
 Probability and Statistics for Engineering and th...StatisticsISBN:9781305251809Author:Jay L. DevorePublisher:Cengage Learning
 Statistics for The Behavioral Sciences (MindTap C...StatisticsISBN:9781305504912Author:Frederick J Gravetter, Larry B. WallnauPublisher:Cengage Learning
  Elementary Statistics: Picturing the World (7th E...StatisticsISBN:9780134683416Author:Ron Larson, Betsy FarberPublisher:PEARSON
 The Basic Practice of StatisticsStatisticsISBN:9781319042578Author:David S. Moore, William I. Notz, Michael A. FlignerPublisher:W. H. Freeman
 Introduction to the Practice of StatisticsStatisticsISBN:9781319013387Author:David S. Moore, George P. McCabe, Bruce A. CraigPublisher:W. H. Freeman
MATLAB: An Introduction with Applications
Statistics
ISBN:9781119256830
Author:Amos Gilat
Publisher:John Wiley & Sons Inc
Probability and Statistics for Engineering and th...
Statistics
ISBN:9781305251809
Author:Jay L. Devore
Publisher:Cengage Learning
Statistics for The Behavioral Sciences (MindTap C...
Statistics
ISBN:9781305504912
Author:Frederick J Gravetter, Larry B. Wallnau
Publisher:Cengage Learning
Elementary Statistics: Picturing the World (7th E...
Statistics
ISBN:9780134683416
Author:Ron Larson, Betsy Farber
Publisher:PEARSON
The Basic Practice of Statistics
Statistics
ISBN:9781319042578
Author:David S. Moore, William I. Notz, Michael A. Fligner
Publisher:W. H. Freeman
Introduction to the Practice of Statistics
Statistics
ISBN:9781319013387
Author:David S. Moore, George P. McCabe, Bruce A. Craig
Publisher:W. H. Freeman