
MATLAB: An Introduction with Applications
6th Edition
ISBN: 9781119256830
Author: Amos Gilat
Publisher: John Wiley & Sons Inc
expand_more
expand_more
format_list_bulleted
Related questions
Topic Video
Question
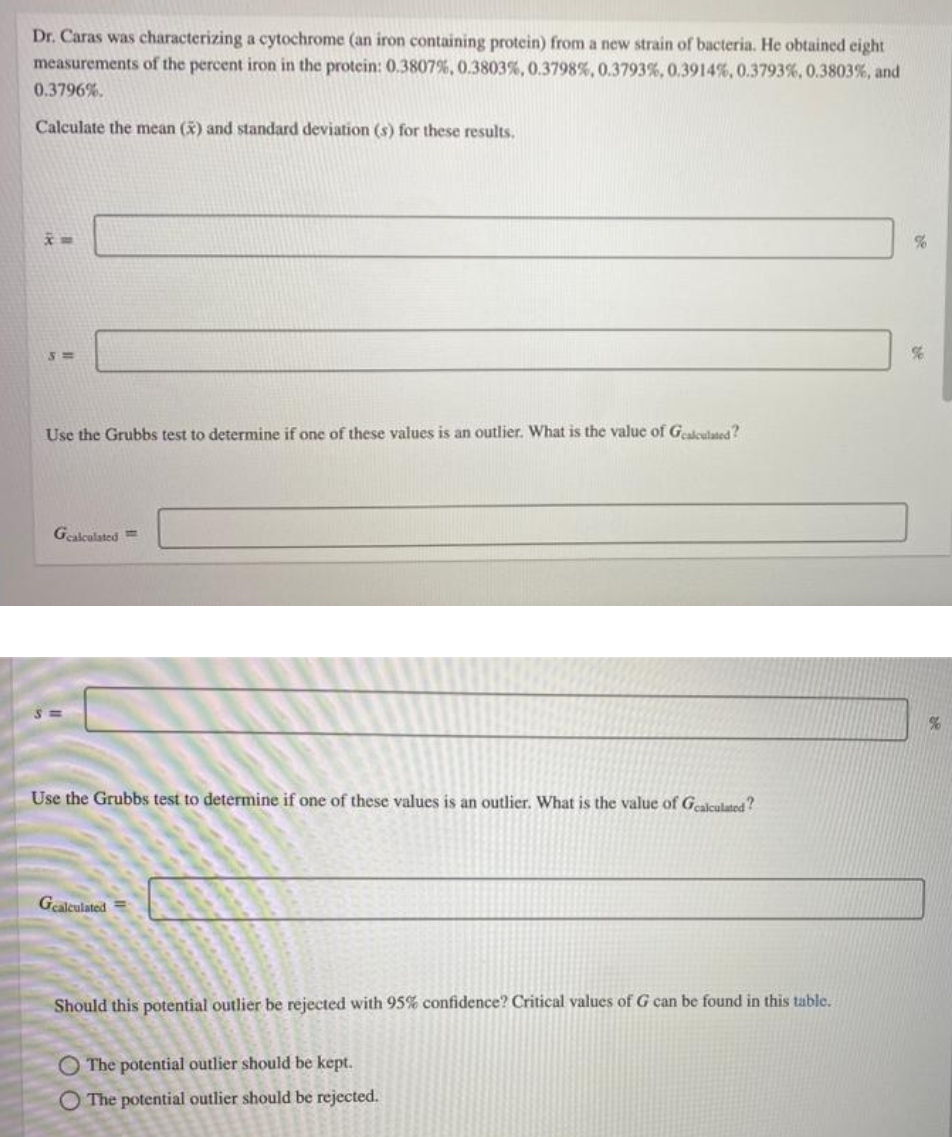

Transcribed Image Text:Dr. Caras was characterizing a cytochrome (an iron containing protein) from a new strain of bacteria. He obtained eight
measurements of the percent iron in the protein: 0.3807%, 0.3803%, 0.3798%, 0.3793%, 0.3914%,0.3793%, 0.3803%, and
0.3796%.
Calculate the mean (x) and standard deviation (s) for these results,
%3=
Use the Grubbs test to determine if one of these values is an outlier. What is the value of Gakculated?
Gealculated =
Use the Grubbs test to determine if one of these values is an outlier. What is the value of Gealculated?
Gealculated
Should this potential outlier be rejected with 95% confidence? Critical values of G can be found in this table.
O The potential outlier should be kept.
O The potential outlier should be rejected.
Expert Solution
This question has been solved!
Explore an expertly crafted, step-by-step solution for a thorough understanding of key concepts.

This is a popular solution

Trending nowThis is a popular solution!

Step by stepSolved in 6 steps with 2 images

Knowledge Booster


Learn more about
Need a deep-dive on the concept behind this application? Look no further. Learn more about this topic, statistics and related others by exploring similar questions and additional content below.Similar questions
- Which store do you think is more expensive—physical or online? A recent survey found that 45% of people aged 20 to 40 thought that physical stores were more expensive. To conduct a follow-up study that would provide 95% confidence that the point estimate is correct to within 0.05 of the population proportion, how many people aged 20 to 40 need to be sampled? (PHStat) To conduct a follow-up study that would provide 99% confidence that the point estimate is correct to within 0.05 of the population proportion, how many people aged 20 to 40 need to be sampled? (PHStat) Compare the results of (a) and (b).arrow_forwardUse the given confidence interval to find the margin of error and the sample mean. (13.5,21.9)arrow_forwardCost of Building a Home According to the National Association of Home Builders, the average cost of building a home in the Northeast is $117.91 per square foot. A random sample of 34 new homes indicated that the mean cost was $120.61and the standard deviation was $17. Can it be concluded that the mean cost differs from $117.91, using the 0.10level of significance? Use the P-value method. Use a graphing calculator. (b) Find the P-value. Round the answer to at least four decimal places. P-value=arrow_forward
- Describe the importnat features of the distribution by identifying the mode, overall shape, and outliers. a. Which measure of center (mean or median) and which measure of variability (Standard deviation or IQR) would be best to describe the distrubution and why?arrow_forwardA psychologist wants to estimate the mean age at which a child learns to talk. Find the sample size necessary for a 95% confidence level to ensure that the sample mean is within 8 weeks for the mean age at which a child learns to talk. Assume sigma as 5 weeks.arrow_forwardResearchers studied the mean egg length (in millimeters) for a bird population. After taking a random sample of eggs, they obtained a 95% confidence interval of (45,60). What is the value of the margin of error? Choose the correct answer below. A. 15 mm B. 52.5 mm O c. 7.5 mm O D. 1.96arrow_forward
- Cost of Building a Home According to the National Association of Home Builders, the average cost of building a home in the Northeast is $117.91 per square foot. A random sample of 42 new homes indicated that the mean cost was $123.87 and the standard deviation was $15. Can it be concluded that the mean cost differs from $117.91, using the 0.05 level of significance? Use the P-value method. Use a graphing calculator. Find the P-value. Round the answer to at least four decimal places. P-value=arrow_forwardThe accompanying histogram shows the lengths of hospital stays (in days) for all female patients admitted to a certain hospital during one year with a primary diagnosis of acute myocardial infarction (heart attack). Complete parts (a) through (c) below. a) From the histogram, determine whether the mean or median is larger. Explain. A. Because the distribution is nearly symmetric, the mean is expected to be larger than the median. B. Because the distribution is nearly symmetric, the mean is expected to be about the same as the median. C. Because the distribution is skewed to the high end, the mean is expected to be larger than the median. D. Because the distribution is skewed to the high end, the mean is expected to be smaller than the median. E. Because the distribution is skewed to the low end, the mean is expected to be larger than the median. F. Because the distribution is skewed to the low end, the mean is expected to be…arrow_forward1. A new brand of chocolate bar is being market tested. Four hundred of the new chocolate bars were given to consumers to try. The consumers were asked whether they liked or disliked the chocolate bar. You are given their responses below. A Response Frequency Liked 360 Disliked 40 Total 400arrow_forward
arrow_back_ios
arrow_forward_ios
Recommended textbooks for you
- MATLAB: An Introduction with ApplicationsStatisticsISBN:9781119256830Author:Amos GilatPublisher:John Wiley & Sons Inc
 Probability and Statistics for Engineering and th...StatisticsISBN:9781305251809Author:Jay L. DevorePublisher:Cengage Learning
 Statistics for The Behavioral Sciences (MindTap C...StatisticsISBN:9781305504912Author:Frederick J Gravetter, Larry B. WallnauPublisher:Cengage Learning
  Elementary Statistics: Picturing the World (7th E...StatisticsISBN:9780134683416Author:Ron Larson, Betsy FarberPublisher:PEARSON
 The Basic Practice of StatisticsStatisticsISBN:9781319042578Author:David S. Moore, William I. Notz, Michael A. FlignerPublisher:W. H. Freeman
 Introduction to the Practice of StatisticsStatisticsISBN:9781319013387Author:David S. Moore, George P. McCabe, Bruce A. CraigPublisher:W. H. Freeman
MATLAB: An Introduction with Applications
Statistics
ISBN:9781119256830
Author:Amos Gilat
Publisher:John Wiley & Sons Inc
Probability and Statistics for Engineering and th...
Statistics
ISBN:9781305251809
Author:Jay L. Devore
Publisher:Cengage Learning
Statistics for The Behavioral Sciences (MindTap C...
Statistics
ISBN:9781305504912
Author:Frederick J Gravetter, Larry B. Wallnau
Publisher:Cengage Learning
Elementary Statistics: Picturing the World (7th E...
Statistics
ISBN:9780134683416
Author:Ron Larson, Betsy Farber
Publisher:PEARSON
The Basic Practice of Statistics
Statistics
ISBN:9781319042578
Author:David S. Moore, William I. Notz, Michael A. Fligner
Publisher:W. H. Freeman
Introduction to the Practice of Statistics
Statistics
ISBN:9781319013387
Author:David S. Moore, George P. McCabe, Bruce A. Craig
Publisher:W. H. Freeman