Economics:
10th Edition
ISBN: 9781285859460
Author: BOYES, William
Publisher: Cengage Learning
expand_more
expand_more
format_list_bulleted
Question
None

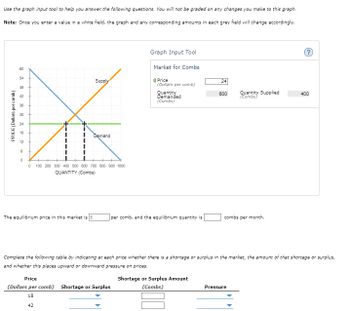
Transcribed Image Text:Use the graph input tool to help you answer the following questions. You will not be graded on any changes you make to this graph.
Note: Once you enter a value in a white field, the graph and any corresponding amounts in each grey field will change accordingly.
PRICE (Dollars per comb)
Graph Input Tool
Market for Combs
60
54
48
24
18
12
+
888 20
42
38
30
Supply
Price
24
(Dollars per comb)
Quantity
Demanded
(Combs)
600
Quantity Supplied
(Combs)
400
Demand
0
100 200 300 400 500 600 700 800 900 1000
QUANTITY (Combs)
The equilibrium price in this market is $
per comb, and the equilibrium quantity is
combs per month.
Complete the following table by indicating at each price whether there is a shortage or surplus in the market, the amount of that shortage or surplus,
and whether this places upward or downward pressure on prices.
Price
(Dollars per comb) Shortage or Surplus
Shortage or Surplus Amount
(Combs)
Pressure
18
42
Expert Solution
This question has been solved!
Explore an expertly crafted, step-by-step solution for a thorough understanding of key concepts.
Step by stepSolved in 2 steps

Knowledge Booster
Similar questions
- What is the consumer's BAB ? Please make sure that your graph is legiblearrow_forwardNote:- Do not provide handwritten solution. Maintain accuracy and quality in your answer. Take care of plagiarism. Answer completely. You will get up vote for sure.arrow_forwardNote:- Do not provide handwritten solution. Maintain accuracy and quality in your answer. Take care of plagiarism. Answer completely. You will get up vote for sure.arrow_forward
- Complete the table below: Output TotalCost(RM) Totalvariablecost(RM) Totalfixedcost(RM)Averagefixedcost(RM)Averagetotalcost(RM)Marginalcost (RM) 0 505 16010 20020 25036 33058 40072 48088 580106 700130 820150 980arrow_forwardAnswer all as they are subparts and get like don't upload any graph. Hand written solutions are strictly prohibited.arrow_forwardTyped plz Please I want up vote on this solution Take care of plagiarismarrow_forward
- The supply equation for a given product is y = 10x + 50, while the demand equation for the same product is given by y = 5x + 350, where x is the price per unit and y is the number of units sold. Find the break-even point, the price and quantity at which supply equals demand. First graph each line, then place a dot indicating the solution to the system. +500 + -450 400 350 300 250 200 150 100 10 50 -50 -100 -150 -200 -250 -300 10 20 30 40 50 60 70 80 90 1arrow_forwardMostly need help with the graph, but a short explanation on how to arrive at the answer for the fill in the blank section would also be great. Thanks!arrow_forwardPlease both are question the correct please ASAP Don't answer by pen paper please ASAP explain.arrow_forward
- do fast i will 5 upvotes.arrow_forward6T Demand for Milk in Smalltown IISA Fill in the Blank Question Refer to the graph as shown. If the price of milk is $2 per gallon, then th consumers would be willing to purchase gall of milk per day. (Enter a number in the blank.) Note:- Do not provide handwritten solution. Maintain accuracy and quality in your answer. Take care of plagiarism. Answer completely. You will get up vote for sure.arrow_forwardUse the green rectangle (triangle symbols) to compute total revenue at various prices along the demand curve. Note: You will not be graded on any changes made to this graph. PRICE (Dollars per scooter) TOTAL REVENUE (Dollars) 195 180 165 910 150 1130 800 1020 090 135 580 120 470 105 360 On the following graph, use the green point (triangle symbol) to plot the weekly total revenue when the market price is $30, $45, $60, $75, $90, $105, and $120 per scooter. 250 75 140 60 45 30 15 0 Demand 03 6 9 12 15 18 21 24 27 30 33 36 39 QUANTITY (Scooters) 0 15 30 45 Total Revenue 60 75 90 105 120 125 150 165 180 195 PRICE (Dollars per scooter) A Total Revenue ? (?) According to the midpoint method, the price elasticity of demand between points A and B is approximately Suppose the price of scooters is currently $30 per scooter, shown as point B on the initial graph. Because the demand between points A and B is in total revenue per week. a $15-per-scooter increase in price will lead to In general,…arrow_forward
arrow_back_ios
SEE MORE QUESTIONS
arrow_forward_ios
Recommended textbooks for you

 Economics Today and Tomorrow, Student EditionEconomicsISBN:9780078747663Author:McGraw-HillPublisher:Glencoe/McGraw-Hill School Pub Co


Economics Today and Tomorrow, Student Edition
Economics
ISBN:9780078747663
Author:McGraw-Hill
Publisher:Glencoe/McGraw-Hill School Pub Co