
MATLAB: An Introduction with Applications
6th Edition
ISBN: 9781119256830
Author: Amos Gilat
Publisher: John Wiley & Sons Inc
expand_more
expand_more
format_list_bulleted
Related questions
Question
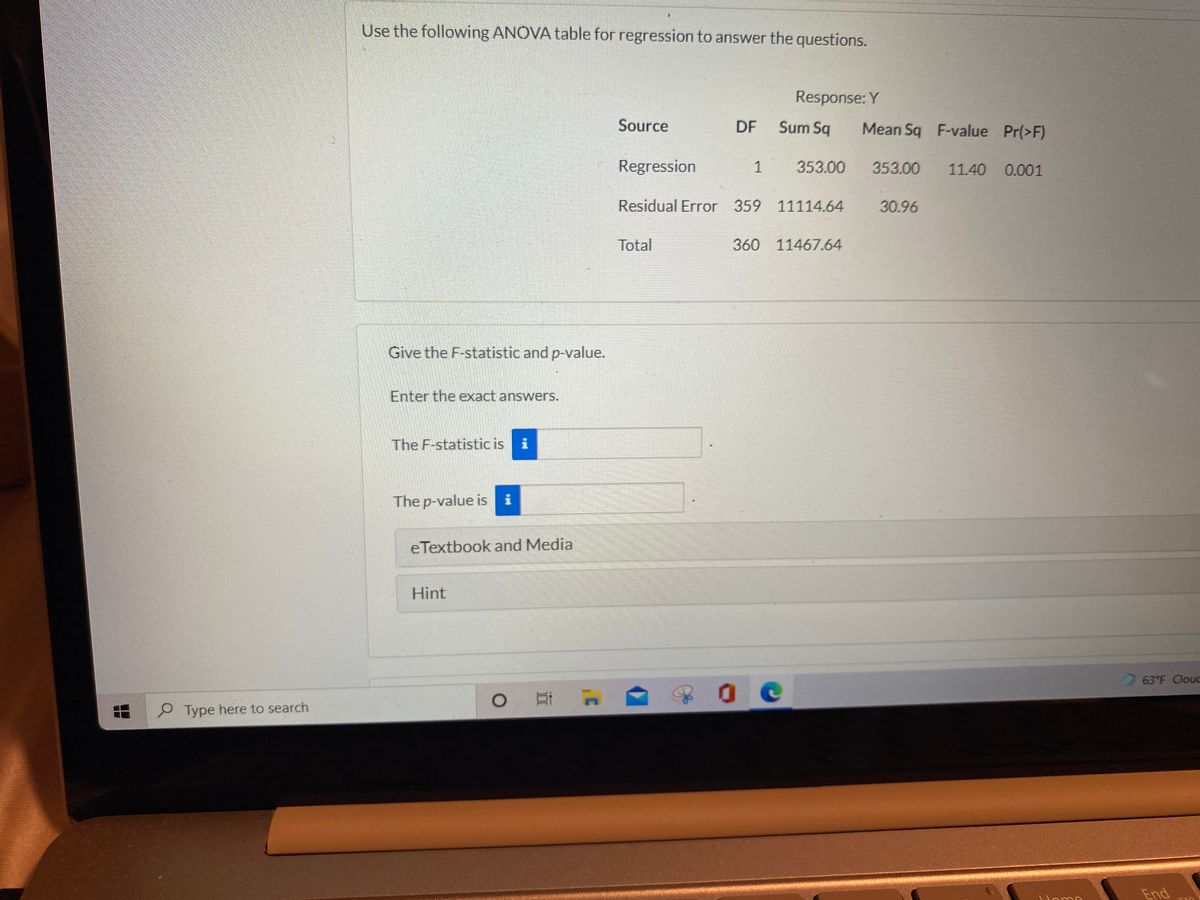

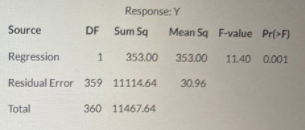
Transcribed Image Text:Use the following ANOVA table for regression to answer the questions.
Response: Y
Source
DF
Sum Sq
Mean Sq F-value Pr(>F)
Regression
1
353.00
353.00
11.40 0.001
Residual Error 359 11114.64
30.96
Total
360
11467.64
Give the F-statistic and p-value.
Enter the exact answers.
The F-statistic is i
The p-value is i
eTextbook and Media
Hint
63°F Clouc
P Type here to search
End
Uome

Transcribed Image Text:Choose the conclusion of this test using a 5 % significance level.
O Reject Ho. The model is effective.
O Do not reject Hn. We did not find evidence that the model is effective.
O Do not reject Ho. We did not find evidence that the model is not effective.
O Reject Ho. The model is not effective.
eTextbook and Media
Hint
Save for Later
Attempts: 0 of
O Type here to search
Home
Esc
DII
PrtScn.
F8
F1
F2
F3
F4
F5
F6
F7
!
#3
$4
1
Tab
W
00
2.
Expert Solution
arrow_forward
Step 1
Given :

Step by stepSolved in 3 steps with 4 images

Knowledge Booster

Similar questions
- Use the value of the linear correlation coefficient to calculate the coefficient of determination. What does this tell you about the explained variation of the data about the regression line? About the unexplained variation? r= - 0.884 Calculate the coefficient of determination. (Round to three decimal places as needed.)arrow_forwardUse the value of the linear correlation coefficient to calculate the coefficient of determination. What does this tell you about the explained variation of the data about the regression line? About the unexplained variation? r = 0.444 Calculate the coefficient of determination. (Round to three decimal places as needed.)arrow_forwardWrite the formula for the estimated regression line and interpret the slope of the estimated regression line, the intercept of the estimated regression line- Is it meaningful?, and the estimated R2. Based on the fitted regression model, what is the predicted ATST for a child who is 7 years old? What is the correlation between AGE and ATST? Does the residual plot suggest that the fitted regression line is inappropriate for these data? Explain why or why not. Suppose that a new subject is added to the study data and that subject is 12.5 years old with an ATST of 580 minutes. If the regression model were to be refit with this additional data point, would the new slope be greater than or less than -14.041? Justify your response.arrow_forward
- r = -0.579 Calculate the coefficient of determination. (Round to three decimal places as needed.) What does this tell you about the explained variation of the data about the regression line? % of the variation can be explained by the regression line. (Round to one decimal place as needed.) About the unexplained variation? % of the variation is unexplained and is due to other factors or to sampling error. (Round to one decimal place as needed.)arrow_forwardWhich of the following tools is not appropriate for studying the relationship between two numerica variables? Correlation coefficient Scatter plot Historam Regressionarrow_forwardPlease fill in the blanks and select the correct answers over the image provided. Thank youarrow_forward
- Interpret the estimated R2 Does the residual plot suggest that the fitted regression line is inappropriate for these data? Explain why or why not. Suppose that a new subject is added to the study data and that subject is 12.5 years old with an ATST of 580 minutes. If the regression model were to be refit with this additional data point, would the new slope be greater than or less than -14.041? Justify your response.arrow_forwardPlease do only the last threearrow_forwardFind the indicated z-score shown in the graph to the right. z Area= 0.0708 z=? 0 A normal curve is over a horizontal z-axis and is centered on 0. A vertical line segment extends from the curve to the horizontal axis at a point labeled z = ?. The area under the curve and to the left of the vertical line segment is shaded and labeled Area = 0.0708. The z-score is enter your response here. (Round to two decimal places as needed.)arrow_forward
arrow_back_ios
arrow_forward_ios
Recommended textbooks for you
- MATLAB: An Introduction with ApplicationsStatisticsISBN:9781119256830Author:Amos GilatPublisher:John Wiley & Sons Inc
 Probability and Statistics for Engineering and th...StatisticsISBN:9781305251809Author:Jay L. DevorePublisher:Cengage Learning
 Statistics for The Behavioral Sciences (MindTap C...StatisticsISBN:9781305504912Author:Frederick J Gravetter, Larry B. WallnauPublisher:Cengage Learning
  Elementary Statistics: Picturing the World (7th E...StatisticsISBN:9780134683416Author:Ron Larson, Betsy FarberPublisher:PEARSON
 The Basic Practice of StatisticsStatisticsISBN:9781319042578Author:David S. Moore, William I. Notz, Michael A. FlignerPublisher:W. H. Freeman
 Introduction to the Practice of StatisticsStatisticsISBN:9781319013387Author:David S. Moore, George P. McCabe, Bruce A. CraigPublisher:W. H. Freeman
MATLAB: An Introduction with Applications
Statistics
ISBN:9781119256830
Author:Amos Gilat
Publisher:John Wiley & Sons Inc
Probability and Statistics for Engineering and th...
Statistics
ISBN:9781305251809
Author:Jay L. Devore
Publisher:Cengage Learning
Statistics for The Behavioral Sciences (MindTap C...
Statistics
ISBN:9781305504912
Author:Frederick J Gravetter, Larry B. Wallnau
Publisher:Cengage Learning
Elementary Statistics: Picturing the World (7th E...
Statistics
ISBN:9780134683416
Author:Ron Larson, Betsy Farber
Publisher:PEARSON
The Basic Practice of Statistics
Statistics
ISBN:9781319042578
Author:David S. Moore, William I. Notz, Michael A. Fligner
Publisher:W. H. Freeman
Introduction to the Practice of Statistics
Statistics
ISBN:9781319013387
Author:David S. Moore, George P. McCabe, Bruce A. Craig
Publisher:W. H. Freeman