
MATLAB: An Introduction with Applications
6th Edition
ISBN: 9781119256830
Author: Amos Gilat
Publisher: John Wiley & Sons Inc
expand_more
expand_more
format_list_bulleted
Related questions
Question
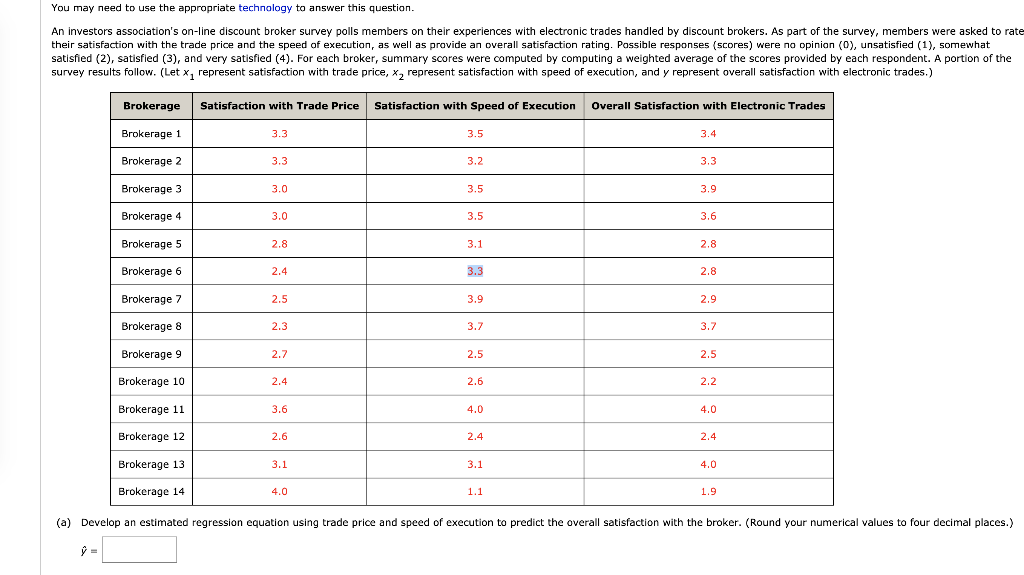

Transcribed Image Text:You may need to use the appropriate technology to answer this question.
An investors association's on-line discount broker survey polls members on their experiences with electronic trades handled by discount brokers. As part of the survey, members were asked to rate
their satisfaction with the trade price and the speed of execution, as well as provide an overall satisfaction rating. Possible responses (scores) were no opinion (0), unsatisfied (1), somewhat
satisfied (2), satisfied (3), and very satisfied (4). For each broker, summary scores were computed by computing a weighted average of the scores provided by each respondent. A portion of the
survey results follow. (Let x, represent satisfaction with trade price, x, represent satisfaction with speed of execution, and y represent overall satisfaction with electronic trades.)
Brokerage
Satisfaction with Trade Price
Satisfaction with Speed of Execution
Overall Satisfaction with Electronic Trades
Brokerage 1
3.3
3.5
3.4
Brokerage 2
3.3
3.2
3.3
Brokerage 3
3.0
3.5
3.9
Brokerage 4
3.0
3.5
3.6
Brokerage 5
2.8
3.1
2.8
Brokerage 6
2.4
3.3
2.8
Brokerage 7
2.5
3.9
2.9
Brokerage 8
2.3
3.7
3.7
Brokerage 9
2.7
2.5
2.5
Brokerage 10
2.4
2.6
2.2
Brokerage 11
3.6
4.0
4.0
Brokerage 12
2.6
2.4
2.4
Brokerage 13
3.1
3.1
4.0
Brokerage 14
4.0
1.1
1.9
(a) Develop an estimated regression equation using trade price and speed of execution to predict the overall satisfaction with the broker. (Round your numerical values to four decimal places.)

Transcribed Image Text:(a) Devekop an estimated regression equation using trede price and speed of execution to predict the overall satisfaction with the broker. (Round your numerical values to four decimal pleces.)
Interpret the coeffidient of determination. (Round your answer to two decimal places.)
This regressikon model explains approximately
|% of the variation in the velues of overall setisfaction in the sample.
(b) Use the e test to determine the significence cf each independent varieble
Test whether the regression parameter , s equal to zero.
Find the p-value. (Round your answer to four decimal places.)
p-value -
What is the conclusion for the test at the 0.05 lavel of significanca?
O we tail to reject Ne We cannot conclude thet there is a reletionship between satistaction with trade price and overal satistaction with the electronic trade.
O We fail to reject He We can condude that there is e relationship between satisfaction with trade price and overall satisfaction with the electronic trade.
O we reject H, We cannot conclude that there is a relationship between satisfaction with trade price and averall satisfaction with the electronic trade.
O We reject Hg. We can conclude that there is a relationship between satisfaction with trade price and overal satisfaction with the elactronic trade.
Test whether the ragression parameter s equal to zero.
Find the p-value. (Round your answer to four decimal places.)
p-value =
What is the conclusion for the test at the 0.05 level of significance?
O Wa fail to rejact H. We can condude that there is a relationship between satisfaction with spoed of axacution and overall satisfaction with the dectranic trade.
O We reject H. We cannot condude that there is a relationship botween satisfaction with spoed of execution and overall satisfaction with the clectronic trade.
O We reject H, We can conclude that there is a reletiorahip between setisfaction with speed of ececution and overall setisfaction with the electronic trade.
O We fall to reject H. We cannot conclude that there is a relationship between satisfaction with speed of execution and overall satistaction with the electroric trade.
(c) Interpret the estimated regression parameters.
(e) Interpret the estimated regression parameters.
A. is our estimate of the overall satisfaction with the electronkc trace when satisfaction with trade prike and satisfaction with speed of aKccution are both-Soloct . d, is our estimate of
change in overall satisfaction with the clectronic trade if we hold satisfaction with Seloct
estimane ef change in averall satisfaction with the electranic trade if we hald satisfaction with -Seec
-Select
v constant and have a 1 point increase in satisfaction withSoloct
constant and have a 1 point inerease in satisfaction with
s our
Are the relationships indicated by these estimates what you would expect?
O ves
O No
(d) An investment company has developed a new ekctronic trading system and would like to predict overall customer satisfaction assuming they can provide satisfactory service leveis (3) for
both trade price and speed of execution. Use the estimated regression equation developed in part (a) to predict the overall satisfaction level for the investment company ir they can achieve
these performance levels. (Round your answer to one decimal place.)
(e) What concerms (If any) do you have with regard to the possible responses the respondents could select on the survey?
This answer haa not bean gradad yat.
Expert Solution
This question has been solved!
Explore an expertly crafted, step-by-step solution for a thorough understanding of key concepts.

This is a popular solution

Trending nowThis is a popular solution!

Step by stepSolved in 2 steps with 1 images

Follow-up Questions
Read through expert solutions to related follow-up questions below.
Follow-up Question
At the .01 level, is the overall regression significant? Explain by showing the relevant value(s)
Solution
by Bartleby Expert
Follow-up Questions
Read through expert solutions to related follow-up questions below.
Follow-up Question
At the .01 level, is the overall regression significant? Explain by showing the relevant value(s)
Solution
by Bartleby Expert
Knowledge Booster

Similar questions
- Data are given below on the adjusted gross income x and the amount of itemized deductions taken by taxpayers. Data were reported in thousands of dollars. With the estimated regression equation = 4.68 + .16x, the point estimate of a reasonable level of total itemized deductions for a taxpayer with an adjusted gross income of $52.5 thousand is $13.08 thousand. Adjusted Gross Income ($1000s) Reasonable Amount ofItemized Deductions ($1000s) 22 9.6 27 9.6 32 10.1 48 11.1 65 13.5 85 17.7 120 25.5 In the questions that follow, enter the dollar amounts requested. For example, if the regression results provide a value of 11.74 thousand, enter 11,740 as the dollar amount in the box. Use Table 1 of Appendix B. Develop a 95% confidence interval for the amount of total itemized deductions for all taxpayers with an adjusted gross income of $52,500 (to the nearest whole number).$ ( , ) Develop a 95% prediction interval for the amount of total…arrow_forwardBloomberg Intelligence listed 50 companies to watch in 2018 (www.bloomberg.com/features/companies-to-watch-2018). Twelve of the companies are listed here with their total assets and 12-month sales. Total Assests ($ billions) 134.47 12-Month Sales ($ billions) Total Assests ($ billions) 12-Month Sales Company Eni SpA Discovery Communications Dong Energy Company AMC Entertainment ($ billions) 68.13 6.59 9.81 4.19 16.15 DSV 6.14 10.54 20.5 Alaska Air Boohoo.com 9.16 10.7 6.9 AMD 3.37 4.62 0.235 0.545 25.11 Cabot Oil & Gas 5.22 1.58 Danone 52.12 Engie 166.84 72 Experian 7.69 4.34 E Click here for the Excel Data File a. Draw a scatter diagram. 1. On the graph below, use the point tool to plot the point corresponding to the first Sales and her Earnings Sales1). 2. Repeat the process for the remainder of the sample (Sales 2, Sales 3, ... ). 3. To enter exact coordinates, dooble-click on the point and enter the exact coordinates of x and y. Tools 90 80 point 2 point 3 70 Ch13_40 18e.xlsx…arrow_forwardPls help ASAP. Pls show all work.arrow_forward
- I’m taking a statistics and probability class. Please get this correct because I want to learn. I have gotten wrong answers on here beforearrow_forwardThe Toyota Camry is one of the best-selling cars in North America. The cost of a previously owned Camry depends upon many factors, including the model year, mileage, and condition. To investigate the relationship between the car's mileage and the sales price for a 2007 model year Camry, the following data show the mileage and sale price for 19 sales (PriceHub website). Click on the datafile logo to reference the data. DATA file 1. 18 Price ($1000s) 16 14 12 10 18 6 If your answer is zero, enter "0". a. Select a scatter diagram with the car mileage on the horizontal axis and the price on the vertical axis. 20 40 6,0 8,0 100 Miles (1000s) 120 223 +♡ ♡ Miles(1000s) 29 36 47 63 77 73 87 92 101 110 28 59 68 68 91 42 65 110 Price ($1000s) 16.2 16.0 13.8 11.5 12.5 12.9 11.2 13.0 11.8 10.8 8.3 12.5 11.1 15.0 12.2 13.0 15.6 12.7 8.3arrow_forwardDevelop a scatterplot and explore the correlation between customer age and net sales by each type of customer (regular/promotion). Use the horizontal axis for the customer age to graph. Find the linear regression line that models the data by each type of customer. Round the rate of changes (slopes) to two decimal places and interpret them in terms of the relation between the change in age and the change in net sales. What can you conclude? Hint: Rate of Change = Vertical Change / Horizontal Change = Change in y / Change in xarrow_forward
arrow_back_ios
arrow_forward_ios
Recommended textbooks for you
- MATLAB: An Introduction with ApplicationsStatisticsISBN:9781119256830Author:Amos GilatPublisher:John Wiley & Sons Inc
 Probability and Statistics for Engineering and th...StatisticsISBN:9781305251809Author:Jay L. DevorePublisher:Cengage Learning
 Statistics for The Behavioral Sciences (MindTap C...StatisticsISBN:9781305504912Author:Frederick J Gravetter, Larry B. WallnauPublisher:Cengage Learning
  Elementary Statistics: Picturing the World (7th E...StatisticsISBN:9780134683416Author:Ron Larson, Betsy FarberPublisher:PEARSON
 The Basic Practice of StatisticsStatisticsISBN:9781319042578Author:David S. Moore, William I. Notz, Michael A. FlignerPublisher:W. H. Freeman
 Introduction to the Practice of StatisticsStatisticsISBN:9781319013387Author:David S. Moore, George P. McCabe, Bruce A. CraigPublisher:W. H. Freeman
MATLAB: An Introduction with Applications
Statistics
ISBN:9781119256830
Author:Amos Gilat
Publisher:John Wiley & Sons Inc
Probability and Statistics for Engineering and th...
Statistics
ISBN:9781305251809
Author:Jay L. Devore
Publisher:Cengage Learning
Statistics for The Behavioral Sciences (MindTap C...
Statistics
ISBN:9781305504912
Author:Frederick J Gravetter, Larry B. Wallnau
Publisher:Cengage Learning
Elementary Statistics: Picturing the World (7th E...
Statistics
ISBN:9780134683416
Author:Ron Larson, Betsy Farber
Publisher:PEARSON
The Basic Practice of Statistics
Statistics
ISBN:9781319042578
Author:David S. Moore, William I. Notz, Michael A. Fligner
Publisher:W. H. Freeman
Introduction to the Practice of Statistics
Statistics
ISBN:9781319013387
Author:David S. Moore, George P. McCabe, Bruce A. Craig
Publisher:W. H. Freeman