MATLAB: An Introduction with Applications
6th Edition
ISBN: 9781119256830
Author: Amos Gilat
Publisher: John Wiley & Sons Inc
expand_more
expand_more
format_list_bulleted
Question
thumb_up100%

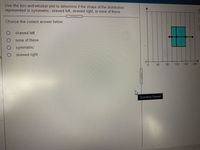
Transcribed Image Text:Use the box-and-whisker plot to determine if the shape of the distribution
represented is symmetric, skewed left, skewed right, or none of these.
Choose the correct answer below.
skewed left
O none of these
symmetric
Oskewed right
日
+0
40
80
120 160
200
Question Viewer
000
Expert Solution
This question has been solved!
Explore an expertly crafted, step-by-step solution for a thorough understanding of key concepts.
This is a popular solution
Trending nowThis is a popular solution!
Step by stepSolved in 2 steps

Knowledge Booster
Similar questions
- Please answer the question in the photo. TY!arrow_forwardThe table below shows the heights, in inches, of 15 randomly selected National Basketball Association (NBA) players and 15 randomly selected Division I National Collegiate Athletic Association (NCAA) Using the same scale, draw a box-and-whisker plot for each of the two data sets, placing the second plot below the first. Write a valid conclusion based on the data.arrow_forwardcould you please answer with paper and pen?arrow_forward
- General Social Survey (GSS) 2006 collected the data of the number of people in each household in the U.S. Question: Describe the shape of the distribution. Skewed to the left, or positively skewed Skewed to the left, or negatively skewed Not skewed, or (almost) symmetrical Skewed to the right, or positively skewed Skewed to the right, or negatively skewedarrow_forwardInterpret the side-by-side (comparative) box-and-whisker plot using the five-number summary. Compare and discuss the typical annual starting salaries for each major. What conclusions can be drawn? Describe each distribution for accounting and marketing majors' annual starting salary.arrow_forwardThe data set shows the ages of all participants in two yoga classes. Complete parts (a) through (d) below. 8:00 P.M. Class 3:00 P.M. Class 77 19 24 18 18 18 68 75 60 25 59 22 33 20 19 69 73 64 53 35 68 71 23 43 18 19 24 76 68 75 55 73 59 31 44 25 20 31 18 77 38 74 (a) Make a back to back stem-and-leaf plot to display the data. 8:00 P.M. Class 3:00 P.M. Class 1 2 3 te 5 6 esc Key: 10 10 7 cce 1-- 4tarrow_forward
- Describe the distribution given the following stem and leaf plot: 0| 2 5 1| 33 2|0 1 3| 11 4| 27 symmetrical skewed left uniform skewed rightarrow_forwardThe following table presents the daily high temperatures for the city of Macon, Georgia, in degrees Fahrenheit, for the winter months of January and February in a recent year. 58 51 71 58 59 67 52 73 64 64 58 67 53 53 63 75 76 61 52 52 68 67 48 55 69 63 58 56 56 63 74 65 57 53 48 70 76 51 65 60 61 Send data to Excel Construct a stem-and-leaf plot, using the digits 4, 5, 6, and 7 as the stems. Do not separate the answers with a comma. If there are no leaves, select the "None" button. 4 None 5 5 6 7 8 ME ›arrow_forwardThe following table presents the daily high temperatures for the city of Macon, Georgia, in degrees Fahrenheit, for the winter months of January and February in a recent year. 67 52 73 58 51 71 58 59 64 64 58 67 53 53 63 75 76 61 52 52 68 67 48 55 69 63 58 56 56 63 74 65 57 53 48 70 76 51 65 60 61 Send data to Excel Construct a stem-and-leaf plot, using the digits 4, 5, 6, and 7 as the stems. Do not separate the answers with a comma. If there are no leaves, select the "None" button. 4 None 5 6 S 7 Xarrow_forward
arrow_back_ios
arrow_forward_ios
Recommended textbooks for you
 MATLAB: An Introduction with ApplicationsStatisticsISBN:9781119256830Author:Amos GilatPublisher:John Wiley & Sons Inc
 Probability and Statistics for Engineering and th...StatisticsISBN:9781305251809Author:Jay L. DevorePublisher:Cengage Learning
 Statistics for The Behavioral Sciences (MindTap C...StatisticsISBN:9781305504912Author:Frederick J Gravetter, Larry B. WallnauPublisher:Cengage Learning
 Elementary Statistics: Picturing the World (7th E...StatisticsISBN:9780134683416Author:Ron Larson, Betsy FarberPublisher:PEARSON
 The Basic Practice of StatisticsStatisticsISBN:9781319042578Author:David S. Moore, William I. Notz, Michael A. FlignerPublisher:W. H. Freeman
 Introduction to the Practice of StatisticsStatisticsISBN:9781319013387Author:David S. Moore, George P. McCabe, Bruce A. CraigPublisher:W. H. Freeman

MATLAB: An Introduction with Applications
Statistics
ISBN:9781119256830
Author:Amos Gilat
Publisher:John Wiley & Sons Inc

Probability and Statistics for Engineering and th...
Statistics
ISBN:9781305251809
Author:Jay L. Devore
Publisher:Cengage Learning

Statistics for The Behavioral Sciences (MindTap C...
Statistics
ISBN:9781305504912
Author:Frederick J Gravetter, Larry B. Wallnau
Publisher:Cengage Learning

Elementary Statistics: Picturing the World (7th E...
Statistics
ISBN:9780134683416
Author:Ron Larson, Betsy Farber
Publisher:PEARSON

The Basic Practice of Statistics
Statistics
ISBN:9781319042578
Author:David S. Moore, William I. Notz, Michael A. Fligner
Publisher:W. H. Freeman

Introduction to the Practice of Statistics
Statistics
ISBN:9781319013387
Author:David S. Moore, George P. McCabe, Bruce A. Craig
Publisher:W. H. Freeman