
MATLAB: An Introduction with Applications
6th Edition
ISBN: 9781119256830
Author: Amos Gilat
Publisher: John Wiley & Sons Inc
expand_more
expand_more
format_list_bulleted
Related questions
Question
Use the answers provided to answer. Include a written summary of your interpretation of the results. In addition, provide your recommendation to the state legislature with a brief explanation as to why you feel it is the best option for implementing public health policy for screening among the target population.
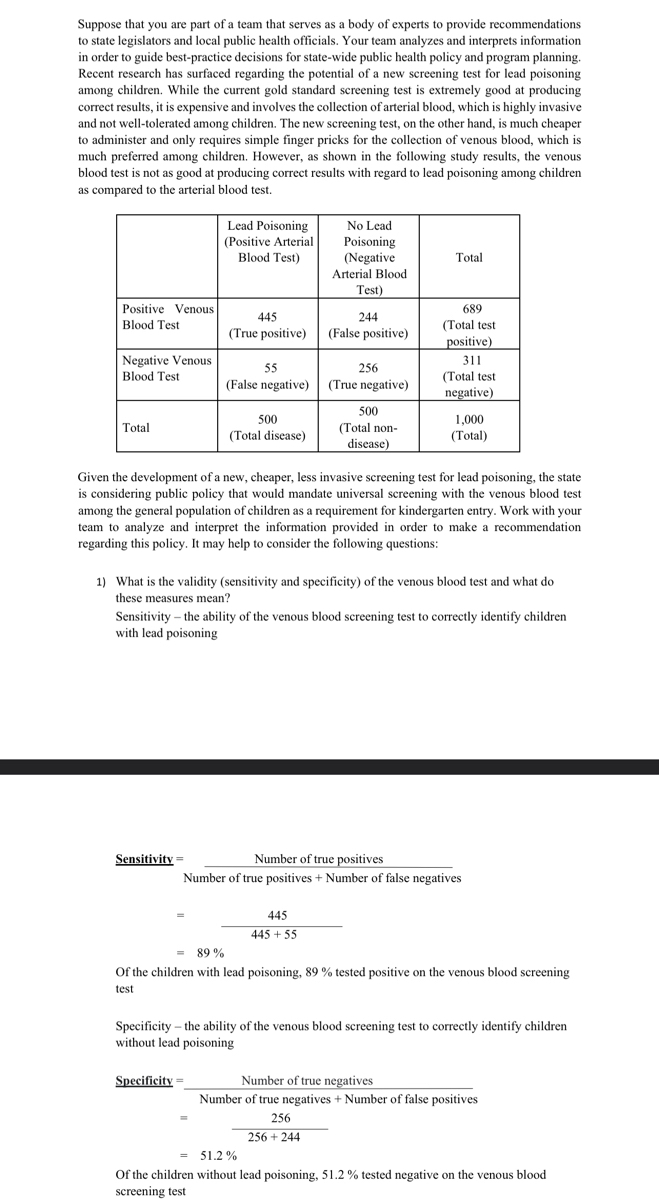

Transcribed Image Text:Suppose that you are part of a team that serves as a body of experts to provide recommendations
to state legislators and local public health officials. Your team analyzes and interprets information
in order to guide best-practice decisions for state-wide public health policy and program planning.
Recent research has surfaced regarding the potential of a new screening test for lead poisoning
among children. While the current gold standard screening test is extremely good at producing
correct results, it is expensive and involves the collection of arterial blood, which is highly invasive
and not well-tolerated among children. The new screening test, on the other hand, is much cheaper
to administer and only requires simple finger pricks for the collection of venous blood, which is
much preferred among children. However, as shown in the following study results, the venous
blood test is not as good at producing correct results with regard to lead poisoning among children
as compared to the arterial blood test.
Positive Venous
Blood Test
Negative Venous
Blood Test
Total
Lead Poisoning
(Positive Arterial
Blood Test)
445
244
(True positive) (False positive)
Sensitivity=
55
256
(False negative) (True negative)
500
(Total disease)
No Lead
Poisoning
(Negative
Arterial Blood
Test)
Specificity-
500
(Total non-
disease)
Total
Given the development of a new, cheaper, less invasive screening test for lead poisoning, the state
is considering public policy that would mandate universal screening with the venous blood test
among the general population of children as a requirement for kindergarten entry. Work with your
team to analyze and interpret the information provided in order to make a recommendation
regarding this policy. It may help to consider the following questions:
445
445 + 55
689
(Total test
positive)
311
1) What is the validity (sensitivity and specificity) of the venous blood test and what do
these measures mean?
(Total test
negative)
Sensitivity - the ability of the venous blood screening test to correctly identify children
with lead poisoning
1,000
(Total)
Number of true positives
Number of true positives + Number of false negatives
256
256 +244
89%
Of the children with lead poisoning, 89 % tested positive on the venous blood screening
test
Specificity - the ability of the venous blood screening test to correctly identify children
without lead poisoning
Number of true negatives
Number of true negatives + Number of false positives
= 51.2%
Of the children without lead poisoning, 51.2 % tested negative on the venous blood
screening test

Transcribed Image Text:Number of true positives
Number of true positives + Number of false negatives
Sensitivity=
445
445 +55
89%
of the children with lead poisoning, 89 % tested positive on the venous blood screening
test
Specificity - the ability of the venous blood screening test to correctly identify children
without lead poisoning
Specificity=
Number of true negatives.
Number of true negatives + Number of false positives
256
256 +244
= 51.2%
Of the children without lead poisoning, 51.2 % tested negative on the venous blood
screening test
2) What is the predictive value (positive and negative) of the venous blood test and what do
these measures mean?
Positive predictive value (PPV) - the ability of the venous blood screening test to produce
a positive result among children with lead poisoning
Positive predictive value=
= 64.5%
True positives
True positives + false positives
445
445 +244
Of the children who tested positive on the venous blood screening test, 64.5 % had lead
poisoning
Negative predictive value (NPV) - the ability of the venous blood screening test to
produce a negative result among children without lead poisoning
Negative predictive value=
True negatives
True negatives + false negatives
256
256 +55
= 82.3%
Of the children who tested negative on the venous blood screening test, 82.3 % did not
have lead poisoning
Expert Solution
This question has been solved!
Explore an expertly crafted, step-by-step solution for a thorough understanding of key concepts.

This is a popular solution

Trending nowThis is a popular solution!

Step by stepSolved in 4 steps

Knowledge Booster

Similar questions
- Surveys were conducted with every 7 households in Muscogee County, asking individuals to report information on their household, such as age, sex, race, education, income levels, and current health care needs. The purpose of the study was to describe the population of Muscogee County and assess the current health care needs of its constituents. 3. What research design was likely used to conduct this research? a. Case report b. Case series c. Ecological Study d. Cross-sectional (descriptive) e. Cross-sectional (analytic) f. Case-control study g. Retrospective cohort study h. Prospective cohort study i. Randomized clinical trialarrow_forwardFor the three-part question that follows, provide your answer to each question in the given workspace. Identify each part with a coordinating response. Be sure to clearly label each part of your response as Part A, Part B, and Part C.Part A: What is the term for a generalization made about a population using the data from a sample?Part B: Name one challenge that may occur when using a sample to draw a conclusion about a population.Part C: A researcher collects data about the annual salary of employees who work in the information technology field. It would be difficult to survey all employees, so a sample of the population is surveyed. The data is recorded below. Use the table to write one conclusion that can be drawn. Explain why this conclusion is valid. Salary Range (Per Year) Number of Employees $50,000-$59,999 147 $60,000-$69,999 159 $70,000-$79,999 225 $80,000-$89,999 27arrow_forwardPLEASE ANSWER ALL THE PARTS OF THE QUESTION ( THIS IS NOT A GRADED ASSIGNMENT)arrow_forward
- Imagine that you own a coffee shop in downtown Toronto. You think it's time to expand to a second location in a different part of the Greater Toronto Area. However, you need to make sure that the second location you have selected will be as popular with customers as your current location. You want to do a survey. You know you can't ask everyone, so you need to ask a sample. PART 1: What process should you follow to select your sample? choices are simple, systematic, stratified, and cluster sampling. PART 2: What is the best way to administer your survey to make sure you get enough responses to give you a good representative sample?arrow_forwardEven though Puerto Rico is a commonwealth of the United States, there are many cultural differences between the states on the continent and the island of Puerto Rico. These differences include the way consumers handle problems with purchases. Two researchers surveyed owners of DVD players in the Northeast United States and in Puerto Rico. They asked those who had experienced problems with their DVD players whether they complained. The results are given in the table below. Location Complained? United States Puerto Rico No 94 33 Yes 330 64arrow_forwardRead the scenario below. Identify the population and sample. Then determine if the bolded value is a parameter or a statistic. Use the appropriate symbol in your answer. A 1993 survey conducted by the Richmond Times-Dispatch one week before Election Day asked voters which candidate for the state's attorney general they would vote for. 37% of the respondents said they would vote for the Democratic candidate. On Election Day, 41% actually voted for the Democratic candidate. The population is The sample is This is a scenario involving The symbol goes with 37% because 37% is a The symbol v goes with 41% because 41% is aarrow_forward
- Below you will find a research scenarios. Your task is to identify the proposed analysis and why you chose that analysis for each of these scenarios. State the research question that aligns with the scenario and the analysis. Next run the appropriate analyses and report your findings in APA Research scenario 2: Historians are interested in the accuracy of eyewitness accounts of traumatic events. One study examined survivors' recall of the sinking of the ship Titanic (Riniolo, Koledin, Drakulic, & Payne, 2003). The researchers reviewed the transcripts of survivors' testimony at governmental hearings (www.titanicinquiry.org) to see whether they testified that the ship was intact or breaking apart during the ship's final plunge (it was in fact breaking apart). To test for eyewitness accuracy, testimony of 20 survivors was examined to see if there was an equal likelihood of survivors saying the ship was intact or breaking apart. Datafile: titanic.xlsx Your response should contain…arrow_forwardadvocacy organization surveys 966 citizens of country A and 186 of them reported being born in another country. Similarly, 177 out of 1213 citizens of country B reported being foreign-born. The researchers want to test if the proportions of foreign born are the e in country B as in country A. Complete parts a through c below. What is the difference in the sample proportions, p, - p2, of foreign born residents from both countries? Assume p, is the proportion of foreign born residents from country A and p, is the proportion of foreign born residents from country B. difference in the sample proportions, p1-P2, is und to three decimal places as needed )arrow_forwardDetermine whether the statement is true or false. If it is false, rewrite it as a true statement. A statistic is a measure that describes a population characteristic. Choose the correct answer below. OA. True. B. False. A statistic is a measure that describes a sample characteristic. OC. False. A statistic is the science of collecting, organizing, analyzing, and interpreting data in order to make decisions.arrow_forward
arrow_back_ios
arrow_forward_ios
Recommended textbooks for you
- MATLAB: An Introduction with ApplicationsStatisticsISBN:9781119256830Author:Amos GilatPublisher:John Wiley & Sons Inc
 Probability and Statistics for Engineering and th...StatisticsISBN:9781305251809Author:Jay L. DevorePublisher:Cengage Learning
 Statistics for The Behavioral Sciences (MindTap C...StatisticsISBN:9781305504912Author:Frederick J Gravetter, Larry B. WallnauPublisher:Cengage Learning
  Elementary Statistics: Picturing the World (7th E...StatisticsISBN:9780134683416Author:Ron Larson, Betsy FarberPublisher:PEARSON
 The Basic Practice of StatisticsStatisticsISBN:9781319042578Author:David S. Moore, William I. Notz, Michael A. FlignerPublisher:W. H. Freeman
 Introduction to the Practice of StatisticsStatisticsISBN:9781319013387Author:David S. Moore, George P. McCabe, Bruce A. CraigPublisher:W. H. Freeman
MATLAB: An Introduction with Applications
Statistics
ISBN:9781119256830
Author:Amos Gilat
Publisher:John Wiley & Sons Inc
Probability and Statistics for Engineering and th...
Statistics
ISBN:9781305251809
Author:Jay L. Devore
Publisher:Cengage Learning
Statistics for The Behavioral Sciences (MindTap C...
Statistics
ISBN:9781305504912
Author:Frederick J Gravetter, Larry B. Wallnau
Publisher:Cengage Learning
Elementary Statistics: Picturing the World (7th E...
Statistics
ISBN:9780134683416
Author:Ron Larson, Betsy Farber
Publisher:PEARSON
The Basic Practice of Statistics
Statistics
ISBN:9781319042578
Author:David S. Moore, William I. Notz, Michael A. Fligner
Publisher:W. H. Freeman
Introduction to the Practice of Statistics
Statistics
ISBN:9781319013387
Author:David S. Moore, George P. McCabe, Bruce A. Craig
Publisher:W. H. Freeman