
MATLAB: An Introduction with Applications
6th Edition
ISBN: 9781119256830
Author: Amos Gilat
Publisher: John Wiley & Sons Inc
expand_more
expand_more
format_list_bulleted
Related questions
Question
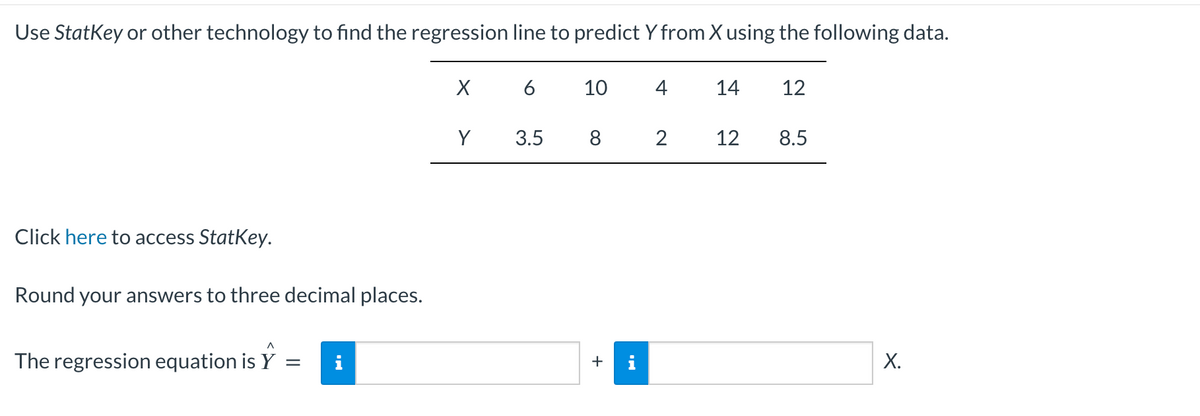

Transcribed Image Text:Use StatKey or other technology to find the regression line to predict Y from X using the following data.
Click here to access StatKey.
Round your answers to three decimal places.
The regression equation is Y
=
X 6
Y
3.5
10
8
+
4
2
14 12
12
8.5
X.
Expert Solution
This question has been solved!
Explore an expertly crafted, step-by-step solution for a thorough understanding of key concepts.

This is a popular solution

Trending nowThis is a popular solution!

Step by stepSolved in 3 steps with 2 images

Knowledge Booster

Similar questions
- Given the data points listed below, use linear regression to find the expression y = %3D mx + b. List the slope of the best-fit line in the box below (round to one digit past the decimal point). y 2 2 3 15 5 14 8 55 |13 68 15 121arrow_forwardThe table shows the approximate chirping rate at various temperatures for one type of cricket. Use the linear regression feature on a graphing calculator to determine an equation of the line that best fits the data. Round to the hundredths. ⒸEncikAn/Shutterstock.com X Temperature (°F) 50 60 70 80 100 Chirps per Minute 20 80 115 150 250arrow_forwardA table of data points is given below. a. Find the regression equation for the data points. Use the formulas Sxx=∑ xi−x2 and Sxy=∑ xi−x yi−y to obtain Sxx and Sxy. b. Graph the regression equation and data points. x 1 2 3 y 6 5 10 a. The regression equation is y= + () x. (Simplify your answers. Type integers or decimals. Do not round.)arrow_forward
- Use the data below for the PHONES questions that follow. Data compiled from the CIA World Factbook, https://www.cia.gov/. The number of cell phones in use in a country can be approximated from the number of main lines in use in that country by using the regression equation yhat=25+3x which had an R² of about 90%. (The numbers here are millions. For example, "1.2" would represent 1.2 million or 1,200,000.) PHONES 1 At the time the data was collected, the USA had about 314 million cell phones in use and about 150 million main lines in use. What was the residual for the USA? Enter a number of millions. For example, if your answer is 2.85 million enter "2.85". Do not enter anything else such as symbols or words.arrow_forwardUse the data in the table below to complete parts (a) through (d). x 37 34 40 46 42 50 62 56 51 y 22 20 25 32 27 30 30 25 28 Find the equation of the regression line. y=arrow_forwardplease help me answer this for my data analysis classarrow_forward
- Part a: Make a scatter plot and determine which type of model best fits the data.Part b: Find the regression equation.Part c: Use the equation from Part b to determine y when x = 1.5.arrow_forwardUse the given data set to answer parts (a) and (b). a. Find the regression equation for the data points. X 5 b. Graph the regression equation and the data points. y -1 10 -10 y B. 10 -10- C. a. Find the regression equation for the data points. ŷ-0 (Use integers or decimals for any numbers in the expression. Round to two decimal places as needed.) b. Graph the regression equation and the data points. O A. 10 T -10- 1 2 -1 3 327 D. -10 4 y 4 28 0arrow_forwardUse the given data to find the equation of the regression line. Round the final values to three significant digits, if necessary.arrow_forward
- Use linear regression to find the equation for the linear function that best fits this data. Click Read Button For online regression calculator. Round both numbers to two decimal places. Write your final answer in a form of an equation y=mx+by=mx+b x 1 2 3 4 5 6 y 74 90 109 123 143 155arrow_forwardFind the intercept (b0) for the regression equation for the following values. Round to 3 decimal places. Intercept xi yi 33 180 25 170 50 200 65 172 57 160 27 165arrow_forward
arrow_back_ios
arrow_forward_ios
Recommended textbooks for you
- MATLAB: An Introduction with ApplicationsStatisticsISBN:9781119256830Author:Amos GilatPublisher:John Wiley & Sons Inc
 Probability and Statistics for Engineering and th...StatisticsISBN:9781305251809Author:Jay L. DevorePublisher:Cengage Learning
 Statistics for The Behavioral Sciences (MindTap C...StatisticsISBN:9781305504912Author:Frederick J Gravetter, Larry B. WallnauPublisher:Cengage Learning
  Elementary Statistics: Picturing the World (7th E...StatisticsISBN:9780134683416Author:Ron Larson, Betsy FarberPublisher:PEARSON
 The Basic Practice of StatisticsStatisticsISBN:9781319042578Author:David S. Moore, William I. Notz, Michael A. FlignerPublisher:W. H. Freeman
 Introduction to the Practice of StatisticsStatisticsISBN:9781319013387Author:David S. Moore, George P. McCabe, Bruce A. CraigPublisher:W. H. Freeman
MATLAB: An Introduction with Applications
Statistics
ISBN:9781119256830
Author:Amos Gilat
Publisher:John Wiley & Sons Inc
Probability and Statistics for Engineering and th...
Statistics
ISBN:9781305251809
Author:Jay L. Devore
Publisher:Cengage Learning
Statistics for The Behavioral Sciences (MindTap C...
Statistics
ISBN:9781305504912
Author:Frederick J Gravetter, Larry B. Wallnau
Publisher:Cengage Learning
Elementary Statistics: Picturing the World (7th E...
Statistics
ISBN:9780134683416
Author:Ron Larson, Betsy Farber
Publisher:PEARSON
The Basic Practice of Statistics
Statistics
ISBN:9781319042578
Author:David S. Moore, William I. Notz, Michael A. Fligner
Publisher:W. H. Freeman
Introduction to the Practice of Statistics
Statistics
ISBN:9781319013387
Author:David S. Moore, George P. McCabe, Bruce A. Craig
Publisher:W. H. Freeman