MATLAB: An Introduction with Applications
6th Edition
ISBN: 9781119256830
Author: Amos Gilat
Publisher: John Wiley & Sons Inc
expand_more
expand_more
format_list_bulleted
Question
![**Box-and-Whisker Plot Analysis of Trout Lengths**
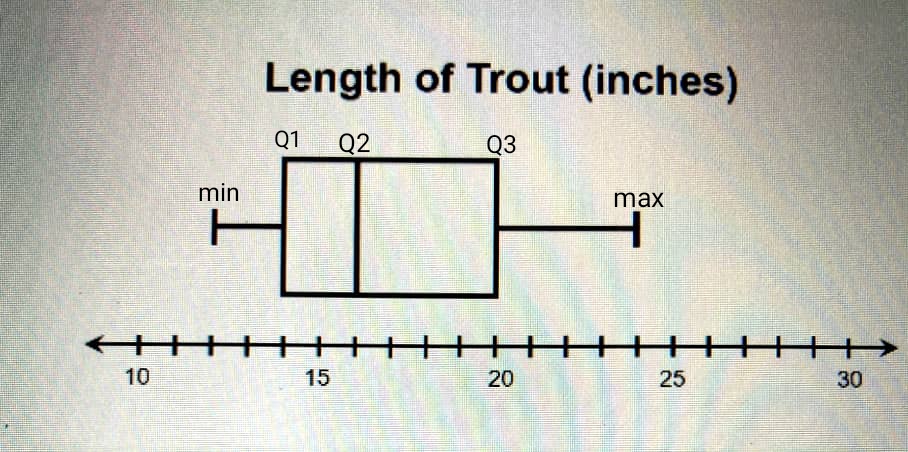
The box-and-whisker plot below represents the length, in inches, of 20 trout caught at Raystown Lake in one weekend.
**Length of Trout (inches)**
[Diagram Explanation]
- The box-and-whisker plot consists of a number line ranging from 10 to 30 inches.
- The box indicates the interquartile range, with the left edge at approximately 12 inches (the lower quartile, Q1) and the right edge at 20 inches (the upper quartile, Q3).
- The line inside the box marks the median (Q2) at around 15 inches.
- Whiskers extend from the box to the minimum at 10 inches and maximum at 28 inches.
**Question:**
How many trout were less than 20 inches long?
**Hint:**
20 inches is the upper quartile of the box-and-whisker plot. So, 75% of the trout were less than 20 inches long.
**Solution:**
To find the answer: multiply the percentage (75%) by 20 (the total number of trout). We use 75% because that is the Q3 in the data. 25% would be our Q1, and 50% is the median (Q2).](https://content.bartleby.com/qna-images/question/779c066b-94fa-4df6-b4e5-b5da5f34d1ed/d735faab-d221-40f9-96d2-2412731a5ef3/dhg0vif_thumbnail.jpeg)
Transcribed Image Text:**Box-and-Whisker Plot Analysis of Trout Lengths**
The box-and-whisker plot below represents the length, in inches, of 20 trout caught at Raystown Lake in one weekend.
**Length of Trout (inches)**
[Diagram Explanation]
- The box-and-whisker plot consists of a number line ranging from 10 to 30 inches.
- The box indicates the interquartile range, with the left edge at approximately 12 inches (the lower quartile, Q1) and the right edge at 20 inches (the upper quartile, Q3).
- The line inside the box marks the median (Q2) at around 15 inches.
- Whiskers extend from the box to the minimum at 10 inches and maximum at 28 inches.
**Question:**
How many trout were less than 20 inches long?
**Hint:**
20 inches is the upper quartile of the box-and-whisker plot. So, 75% of the trout were less than 20 inches long.
**Solution:**
To find the answer: multiply the percentage (75%) by 20 (the total number of trout). We use 75% because that is the Q3 in the data. 25% would be our Q1, and 50% is the median (Q2).

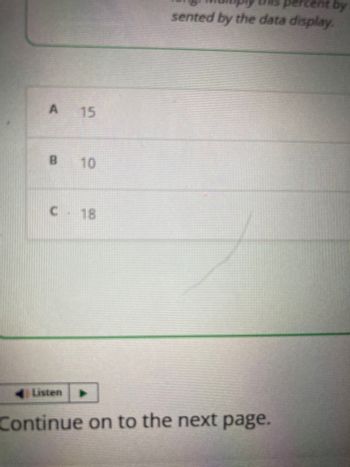
Transcribed Image Text:The image contains a multiple-choice format with the following options:
- **A**: 15
- **B**: 10
- **C**: 18
Below the options, there is a button labeled "Listen" with a play icon. At the bottom, there is an instruction that reads, "Continue on to the next page."
There are no graphs or diagrams present in the image.
Expert Solution
arrow_forward
Step 1: We have given that

Step by stepSolved in 3 steps with 1 images

Knowledge Booster
Similar questions
- Which of the three measurements, mean, median, or mode, is the most influenced by an outlier value that is either much higher or lower than the others in the dataset? Explain how you chose your answer in the space provided below.arrow_forwardRecherchers conducted two surveys about teens are their use of social media. The First survey asked a Random sample of 800 U.S. teens about their use of Instagram. A second survey asked the same question to a Random sample of 2253 Canadian teens. In these two studies. 73% of U.S. teens and 88% of Canadian teens said that they use instagram. Use these results to answee the following questions about the proportion of U.S. and Canadian teens that use instagram. (Round to the nearest whole hundredth as needed).arrow_forwarda survey was given to 18 students. one question asked about the one-way distance the student had to travel to attend college. the results, in miles, are shown in the following table. use the median procedure for finding quartiles to find the first, second and third quartiles for the data.arrow_forward
- Find the value of so that 92.3% of the data lies to the right of it.arrow_forwardStephanie is trying to figure out the sample size of an experiment. She knows the population SD is 41.5 and the SD of the sample averages is 2.7. What is the sample size of the experiment?arrow_forwardYou want to estimate the percentage of statistics students who get grades of C or better. How many students should you survey to be 95% confident that the sample percentage is off by no more than 2 percentage points.arrow_forward
- You are testing the claim that the proportion of men who own cats is larger than the proportion of women who own cats.You sample 160 men, and 15% own cats.You sample 60 women, and 20% own cats.Find the test statisticarrow_forwarddoesn't the mean of a sample population equal the true proportion?arrow_forwardIf the proportion of Heads is .25 out of 200 flips, what is the p-value? Round to three places.arrow_forward
- You are testing the claim that the proportion of men who own cats is larger than the proportion of women who own cats.You sample 180 men, and 75% own cats.You sample 100 women, and 60% own cats.Find the test statistic.arrow_forwardWhat is the t statistic for the top 3% for a sample size of 19.arrow_forwardWhat is the p value ?arrow_forward
arrow_back_ios
SEE MORE QUESTIONS
arrow_forward_ios
Recommended textbooks for you
 MATLAB: An Introduction with ApplicationsStatisticsISBN:9781119256830Author:Amos GilatPublisher:John Wiley & Sons Inc
 Probability and Statistics for Engineering and th...StatisticsISBN:9781305251809Author:Jay L. DevorePublisher:Cengage Learning
 Statistics for The Behavioral Sciences (MindTap C...StatisticsISBN:9781305504912Author:Frederick J Gravetter, Larry B. WallnauPublisher:Cengage Learning
 Elementary Statistics: Picturing the World (7th E...StatisticsISBN:9780134683416Author:Ron Larson, Betsy FarberPublisher:PEARSON
 The Basic Practice of StatisticsStatisticsISBN:9781319042578Author:David S. Moore, William I. Notz, Michael A. FlignerPublisher:W. H. Freeman
 Introduction to the Practice of StatisticsStatisticsISBN:9781319013387Author:David S. Moore, George P. McCabe, Bruce A. CraigPublisher:W. H. Freeman

MATLAB: An Introduction with Applications
Statistics
ISBN:9781119256830
Author:Amos Gilat
Publisher:John Wiley & Sons Inc

Probability and Statistics for Engineering and th...
Statistics
ISBN:9781305251809
Author:Jay L. Devore
Publisher:Cengage Learning

Statistics for The Behavioral Sciences (MindTap C...
Statistics
ISBN:9781305504912
Author:Frederick J Gravetter, Larry B. Wallnau
Publisher:Cengage Learning

Elementary Statistics: Picturing the World (7th E...
Statistics
ISBN:9780134683416
Author:Ron Larson, Betsy Farber
Publisher:PEARSON

The Basic Practice of Statistics
Statistics
ISBN:9781319042578
Author:David S. Moore, William I. Notz, Michael A. Fligner
Publisher:W. H. Freeman

Introduction to the Practice of Statistics
Statistics
ISBN:9781319013387
Author:David S. Moore, George P. McCabe, Bruce A. Craig
Publisher:W. H. Freeman