
MATLAB: An Introduction with Applications
6th Edition
ISBN: 9781119256830
Author: Amos Gilat
Publisher: John Wiley & Sons Inc
expand_more
expand_more
format_list_bulleted
Related questions
Question
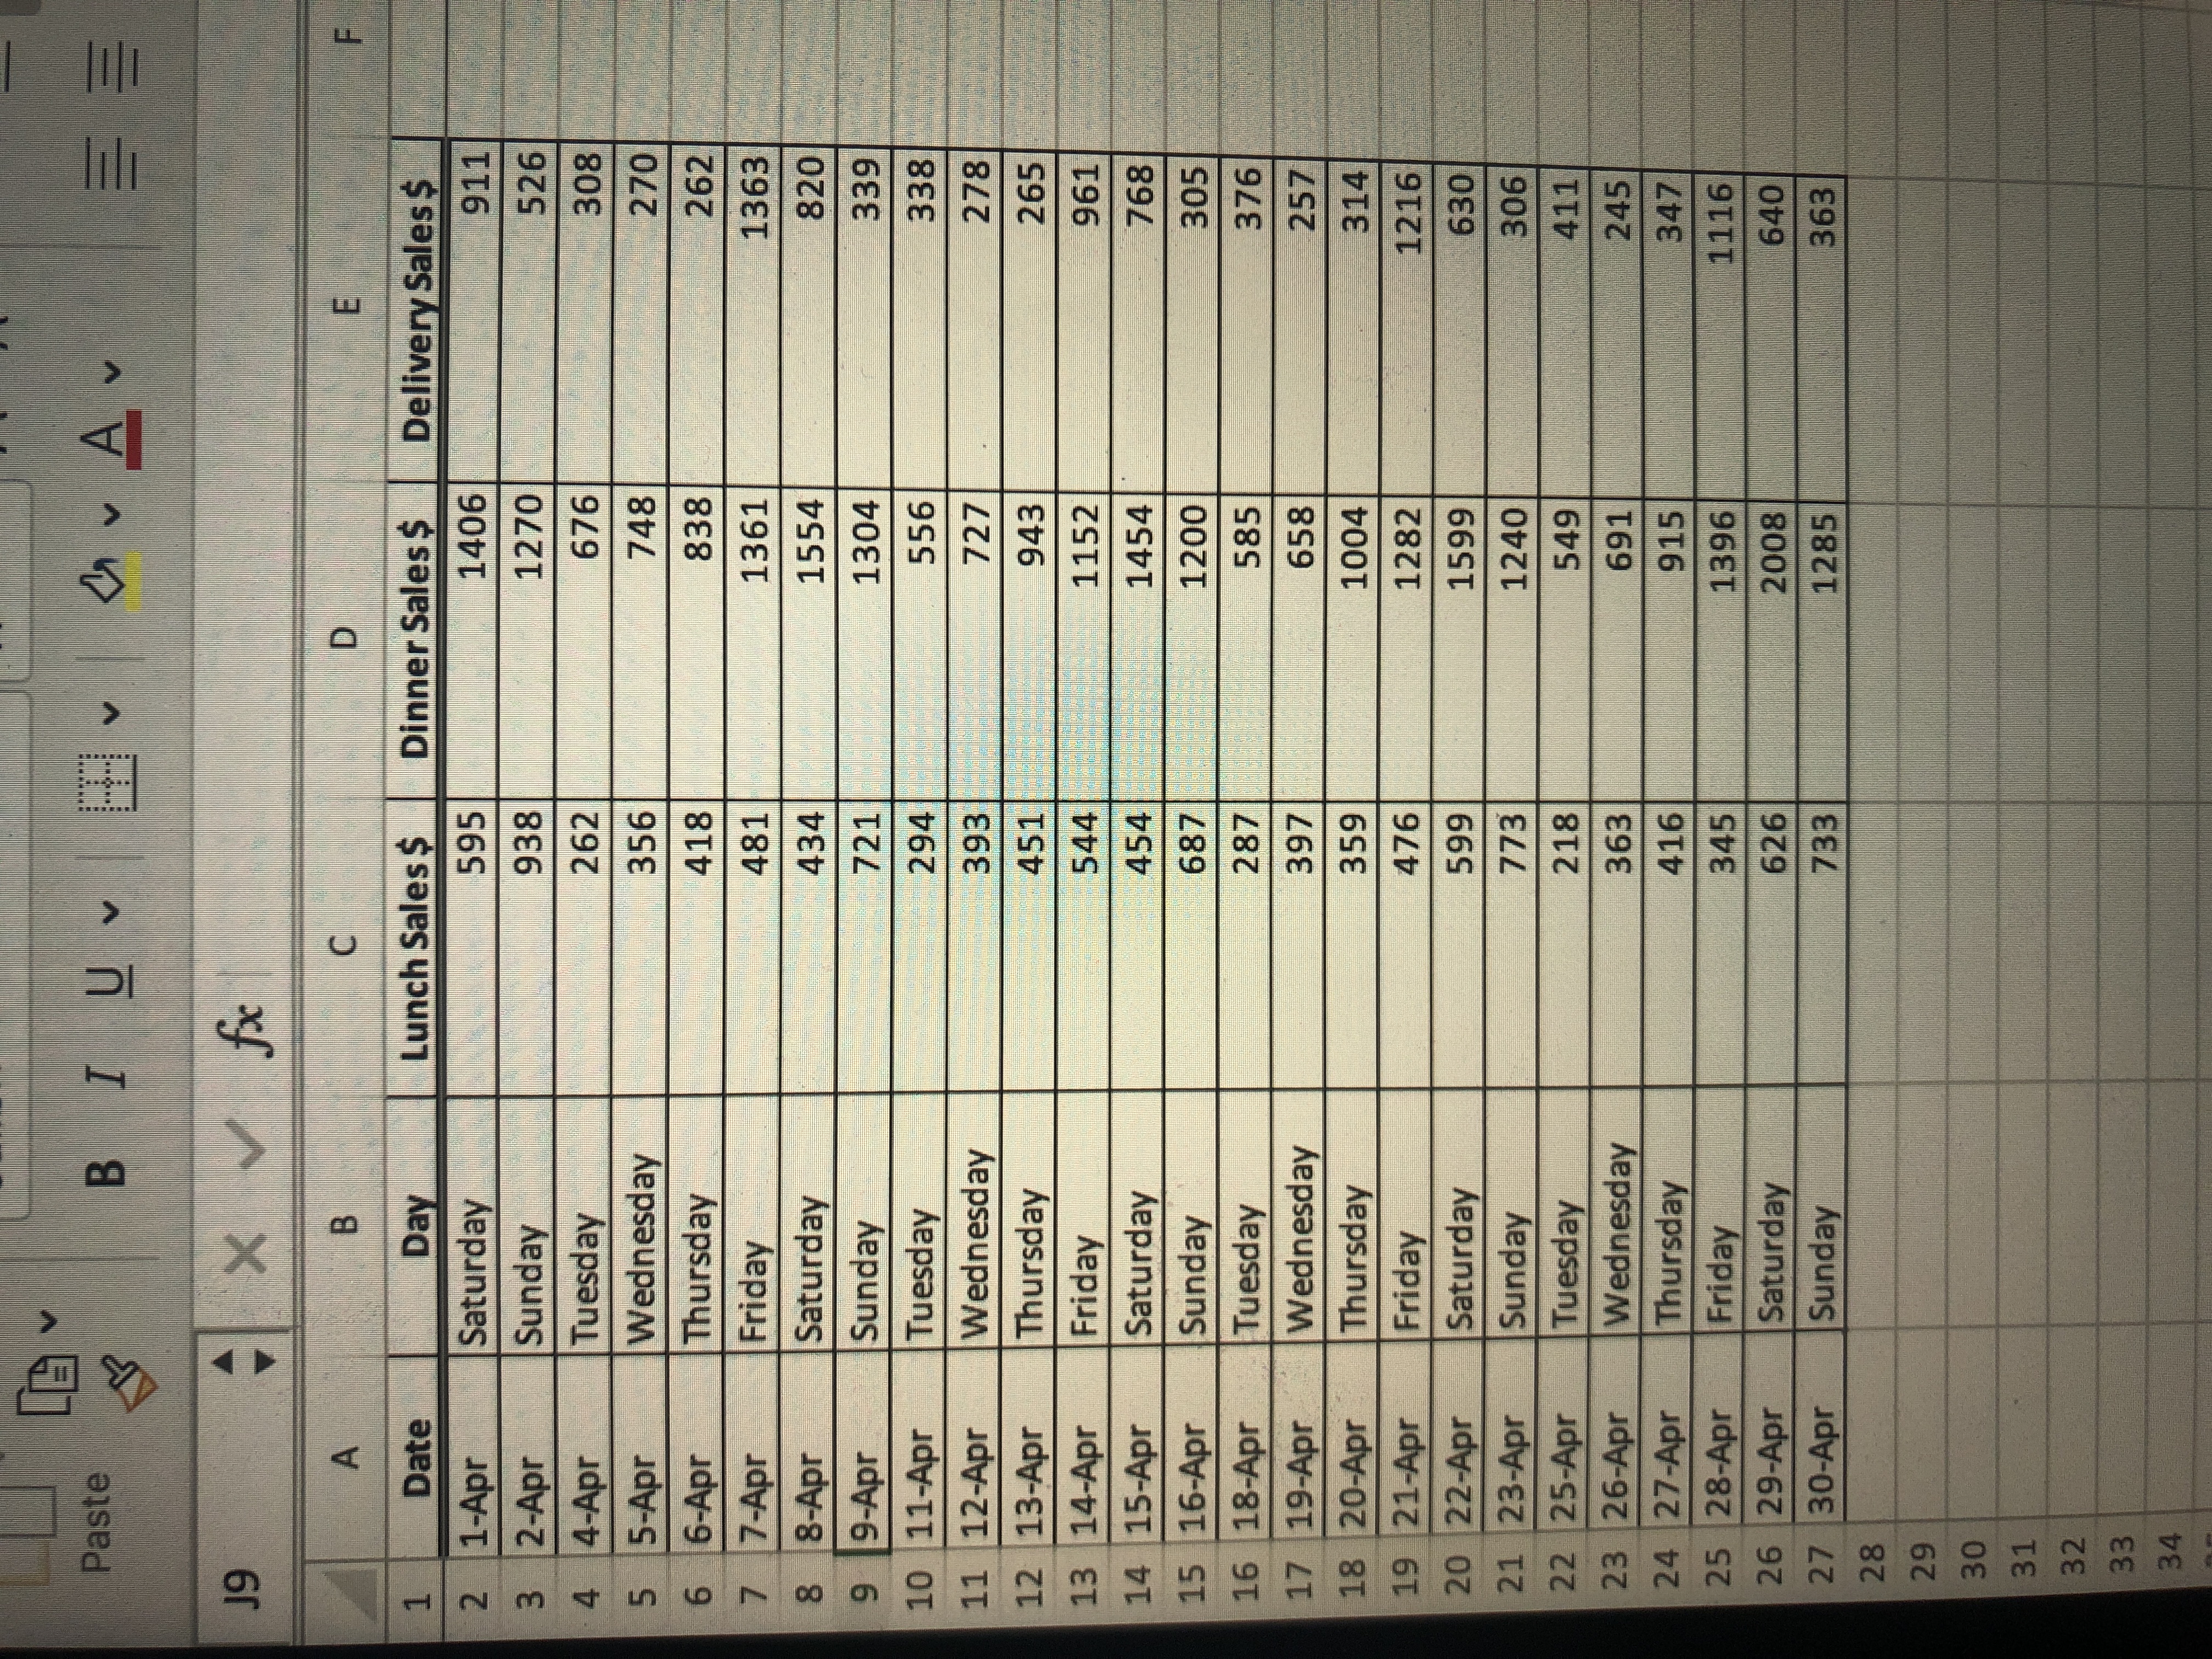
Use a pivot table to construct a frequency distribution and histogram of lunch sales amounts for the data provided.

Transcribed Image Text:Paste
*******
町
61
xf ^ X
D.
Dinner Sales $
B.
F.
Delivery Sales $
911
Lunch Sales $
ay
Saturday
Date
90
1270
595
2 1-Apr
3 2-Apr
4 4-Apr
5 5-Apr
6 6-Apr
7 7-Apr
8 8-Apr
9 9-Apr
10 11-Apr
11 12-Apr
12 13-Apr
13 14-Apr
14 15-Apr
15 16-Apr
16 18-Apr
17 19-Apr
18 20-Apr
19 21-Apr
20 22-Apr
21 23-Apr
22 25-Apr
23 26-Apr
24 27-Apr
25 28-Apr
26 29-Apr
27 30-Apr
Sunday
938
526
676
308
Tuesday
Wednesday
262
356
748
270
Thursday
418
838
262
1361
1363
Friday
Saturday
481
434
1554
820
Sunday
721
1304
Tuesday
294
556
338
Wednesday
393
727
278
Thursday
451
943
265
Friday
544
1152
897
305
Saturday
454
1454
1200
687
287
Sunday
Tuesday
585
376
Wednesday
658
257
Thursday
1004
314
Friday
476
1282
1216
Saturday
630
Sunday
773
1240
411
Tuesday
Wednesday
Thursday
Friday
Saturday
363
245
416
915
347
1116
9
2008
345
626
640
Sunday
733
1285
363
28
2 T
30
31
32
33
34
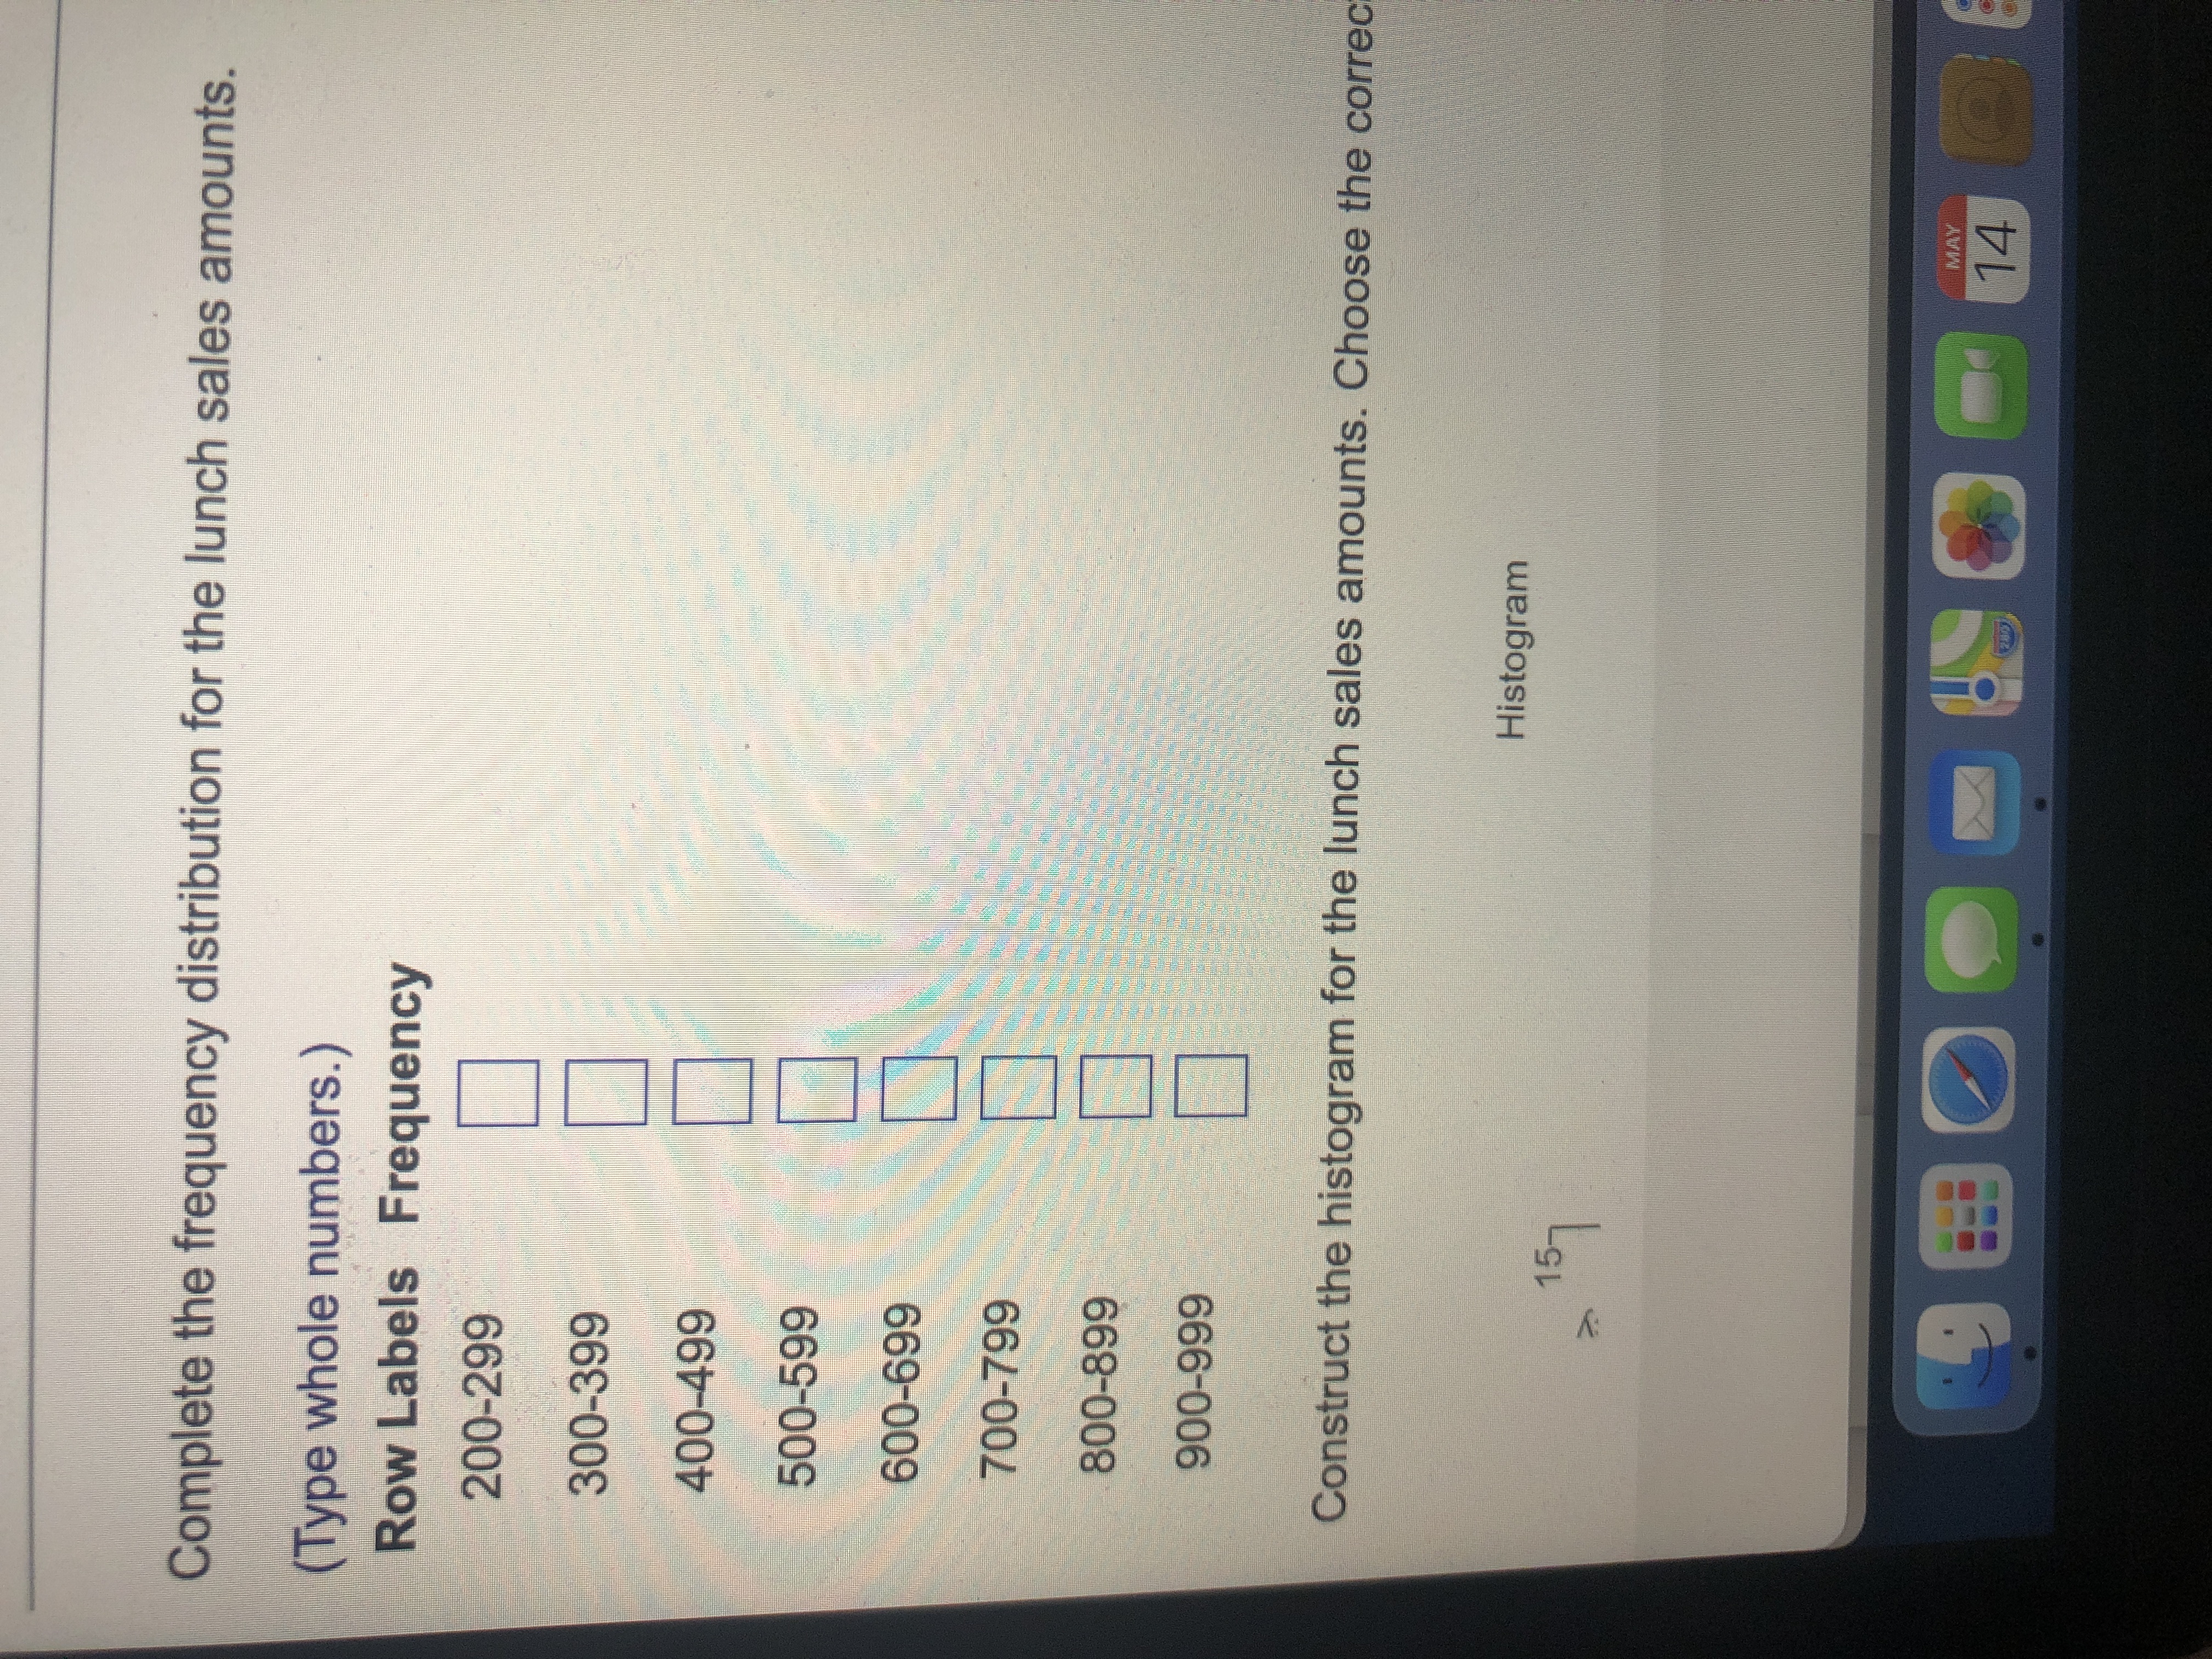
Transcribed Image Text:Complete the frequency distribution for the lunch sales amounts.
(Type whole numbers.)
Row Labels Frequency
200-299
300-399
400-499
500-599
669-009
700-799
666-006
Construct the histogram for the lunch sales amounts. Choose the correc:
Histogram
15
MAY
14
Expert Solution
This question has been solved!
Explore an expertly crafted, step-by-step solution for a thorough understanding of key concepts.

This is a popular solution

Trending nowThis is a popular solution!

Step by stepSolved in 4 steps with 6 images

Knowledge Booster

Similar questions
- 5.Identify the following as being discrete or continuous data. Explain.a. The average number of pets was 1.823b. The puppy weighed 2 poundsarrow_forwardRichard’s doctor had told him he needed to keep track of his blood sugar readings. Listed below are his 20 latest readings. He wanted to create a visual aid for himself in order to see how his blood sugar was doing. 75 125 110 82 178 209 150 130 120 142 90 98 107 163 135 129 147 152 110 100 A. Create a frequency distribution table for the given data set. B. Create a histogram for the data set. C. Describe the distribution of the data.arrow_forwardMembers of the student council are seling bagels during each class period of the school day for a fundrasier. Yu-na made a scatter plot to see if there was a relationship between the class period and the number of bagels sold.Yu-na draws a line of best fit. Which of these lines is the best model for the data?arrow_forward
- Several years ago, the state of California launched an aggressively advertisement campaign against smoking. We've interviewed students from 16 college campuses in California and recorded for each campus the percentage of students who claimed that they had encountered assay least one anti smoking advertisement on campus in the past month. Here are those percentages. 53 39 30 49 48 42 41 38 26 36 40 42 52 51 45 50 Construct a box and whisker plot for the data.arrow_forwardThe following frequency table summarizes a set of data. What is the five-number summary? Value Frequency 2 3 3 2 5 1 6 3 7 1 8 2 11 3arrow_forwardIs the following nominal, ordinal, or interval data? Explain your answer. Stock pricesarrow_forward
- In a study, researchers wanted to measure the effect of alcohol on the hippocampal region, the portion of the brain responsible for long-term memory storage, in adolescents. The researchers randomly selected 23 adolescents with alcohol use disorders to determine whether the hippocampal volumes in the alcoholic adolescents were less than the normal volume of 9.02 cm. An analysis of the sample data revealed that the hippocampal volume is approximately normal with no outliers and x 8.18 cm and s=0.8 cm. Conduct the appropriate test at the a= 0.01 level of significance. State the null and alternative hypotheses. Ho: H H1: (Type integers or decimals. Do not round.) Identify the t-statistic. to = (Round to two decimal places as needed.) !! Identify the P-value. P-value = (Round to three decimal places as needed.) Make a conclusion regarding the hypothesis. the null hypothesis. There sufficient evidence to claim that the mean hippocampal volume is cm³ Statcrunch Next 8:01 SAMSUNG esc @ %23 $…arrow_forwardConsider this set of data: 4.5 3.2 3.5 3.9 3.5 3.9 4.3 4.8 3.6 3.3 4.3 4.2 3.9 3.7 4.3 4.4 3.4 4.2 4.4 4.0 3.6 3.5 3.9 4.0 Construct a stem and leaf plot by using the leading digit as the stem. Construct a stem and leaf plot by using each leading digit twice. Does this technique improve the presentation of the data? Explain.arrow_forwardA County Board of Supervisors has appointed an urban planning committee to evaluate proposed community development projects. The committee is analyzing, among other things, data on household incomes in two cities within the county. They have collected data on the income of 77 households in each of the two cities. The histograms below show the distributions of the two sets of incomes (in thousands of dollars). Each histogram shows household income on the horizontal axis and number of households on the vertical axis. The means and standard deviations for the data sets are also given. City A City B 25+ 20+ 15+ 10+ 5- ← 10 20 30 40 50 60 70 80 90 100 City A mean: 73.96 thousand dollars City A standard deviation: 20.30 thousand dollars Explanation 25- 20- 15- 104 5+ 10 (a) Identify the data set for which it is appropriate to use the Empirical Rule. It is appropriate to use the Empirical Rule for the (Choose one) ▼ data set. 20 30 The committee wants to use the Empirical Rule to make some…arrow_forward
arrow_back_ios
SEE MORE QUESTIONS
arrow_forward_ios
Recommended textbooks for you
- MATLAB: An Introduction with ApplicationsStatisticsISBN:9781119256830Author:Amos GilatPublisher:John Wiley & Sons Inc
 Probability and Statistics for Engineering and th...StatisticsISBN:9781305251809Author:Jay L. DevorePublisher:Cengage Learning
 Statistics for The Behavioral Sciences (MindTap C...StatisticsISBN:9781305504912Author:Frederick J Gravetter, Larry B. WallnauPublisher:Cengage Learning
  Elementary Statistics: Picturing the World (7th E...StatisticsISBN:9780134683416Author:Ron Larson, Betsy FarberPublisher:PEARSON
 The Basic Practice of StatisticsStatisticsISBN:9781319042578Author:David S. Moore, William I. Notz, Michael A. FlignerPublisher:W. H. Freeman
 Introduction to the Practice of StatisticsStatisticsISBN:9781319013387Author:David S. Moore, George P. McCabe, Bruce A. CraigPublisher:W. H. Freeman
MATLAB: An Introduction with Applications
Statistics
ISBN:9781119256830
Author:Amos Gilat
Publisher:John Wiley & Sons Inc
Probability and Statistics for Engineering and th...
Statistics
ISBN:9781305251809
Author:Jay L. Devore
Publisher:Cengage Learning
Statistics for The Behavioral Sciences (MindTap C...
Statistics
ISBN:9781305504912
Author:Frederick J Gravetter, Larry B. Wallnau
Publisher:Cengage Learning
Elementary Statistics: Picturing the World (7th E...
Statistics
ISBN:9780134683416
Author:Ron Larson, Betsy Farber
Publisher:PEARSON
The Basic Practice of Statistics
Statistics
ISBN:9781319042578
Author:David S. Moore, William I. Notz, Michael A. Fligner
Publisher:W. H. Freeman
Introduction to the Practice of Statistics
Statistics
ISBN:9781319013387
Author:David S. Moore, George P. McCabe, Bruce A. Craig
Publisher:W. H. Freeman