
MATLAB: An Introduction with Applications
6th Edition
ISBN: 9781119256830
Author: Amos Gilat
Publisher: John Wiley & Sons Inc
expand_more
expand_more
format_list_bulleted
Related questions
Question
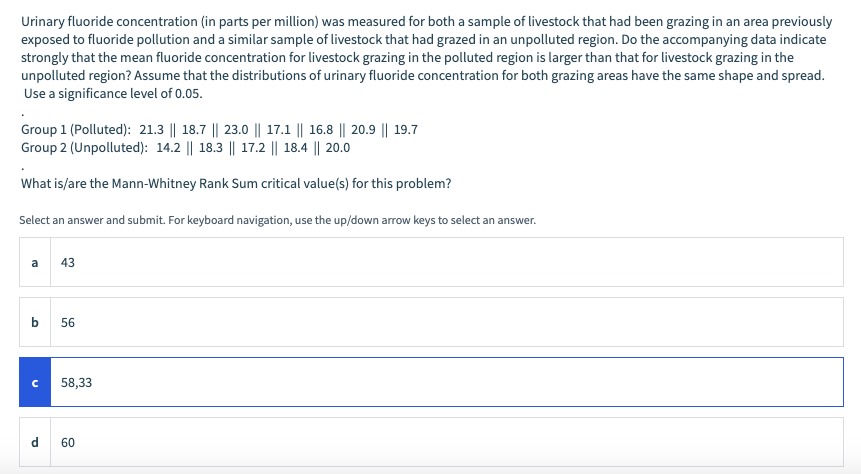

Transcribed Image Text:Urinary fluoride concentration (in parts per million) was measured for both a sample of livestock that had been grazing in an area previously
exposed to fluoride pollution and a similar sample of livestock that had grazed in an unpolluted region. Do the accompanying data indicate
strongly that the mean fluoride concentration for livestock grazing in the polluted region is larger than that for livestock grazing in the
unpolluted region? Assume that the distributions of urinary fluoride concentration for both grazing areas have the same shape and spread.
Use a significance level of 0.05.
Group 1 (Polluted): 21.3 || 18.7 || 23.0 || 17.1 || 16.8 || 20.9 || 19.7
Group 2 (Unpolluted): 14.2 || 18.3 || 17.2 || 18.4 || 20.0
What is/are the Mann-Whitney Rank Sum critical value(s) for this problem?
Select an answer and submit. For keyboard navigation, use the up/down arrow keys to select an answer.
a
43
b 56
n
58,33
d 60
Expert Solution
This question has been solved!
Explore an expertly crafted, step-by-step solution for a thorough understanding of key concepts.

This is a popular solution

Trending nowThis is a popular solution!

Step by stepSolved in 3 steps with 3 images

Knowledge Booster

Similar questions
- Inorganic phosphorous is a naturally occurring element in all plants and animals, with concentrations increasing progressively up the food chain (fruit < vegetables < cereals < nuts < corpse). Geochemical surveys take soil samples to determine phosphorous content (in ppm, parts per million). A high phosphorous content may or may not indicate an ancient burial site, food storage site, or even a garbage dump. Independent random samples from two regions gave the following phosphorous measurements (in ppm). Assume the distribution of phosphorous is mound-shaped and symmetric for these two regions. Region I: x1; n1 = 15 853 1,549 1,230 875 1,080 2,330 1,850 1,860 2,340 1,080 910 1,130 1,450 1,260 1,010 Region II: x2; n2 = 14 538 808 790 1,230 1,770 960 1,650 860 890 640 1,180 1,160 1,050 1,020 (a) Use a calculator with mean and standard deviation keys to verify that x1, s1, x2, and s2. (Round your answers to four decimal places.) x1= ppm s1= ppm x2= ppm s2=…arrow_forwardAn article reports the following values for soil heat flux of eight plots covered with coal dust. 35.0 32.8 35.0 33.6 36.7 27.0 18.7 24.7 USE SALT The mean soil heat flux for plots covered only with grass is 29.0. Assuming that the heat-flux distribution is approximately normal, does the data suggest that the coal dust is effective in increasing the mean heat flux over that for grass? Test the appropriate hypotheses using a = 0.05. State the appropriate hypotheses. OH₂M = 29 H₂:μ#29 OH₂ = 29 H₂:μ 29 Calculate the test statistic and determine the P-value. (Round your test statistic to two decimal places and your P-value to three decimal places.) t = P-value = State the conclusion in the problem context. O Do not reject the null hypothesis. There is sufficient evidence to conclude that there was an increase in mean heat flux. O Reject the null hypothesis. There is sufficient evidence to conclude that there was an increase in mean heat flux. O Do not reject the null hypothesis. There is…arrow_forwardInorganic phosphorous is a naturally occurring element in all plants and animals, with concentrations increasing progressively up the food chain (fruit < vegetables < cereaise nuts < corpse). Geochemical surveys take soil samples to determine phosphorous content (in ppm, parts per million). A high phosphorous content may or may not indicate an ancient burial site, food storage site, or even a garbage dump. Independent random samples from two regions gave the following phosphorous measurements (in ppm). Assume the distribution of phosphorous is mound-shaped and symmetric for these two regions. Region It x n, 15 857 1,551 1,230 875 1,080 2,330 1,850 1,860 2,340 1,080 910 1,130 1,450 1,260 1,010 Region III xi n 14 542 B06 1,230 1,770 790 960 1,650 860 890 640 1,180 1,160 1,050 1,020 A USE SALT (a) Use a caiculator with mean and standard deviation keys to verify that a and s (Round your answers to four decimal places.) ppm ppm ppm ppm (b) Let , be the population mean for x, and let be the…arrow_forward
- The failure of a component of a system has a Weibull distribution with shape parameter equal to 1.0. This is equivalent to an exponential distribution for a constantfailure rate. If the scale parameter is 20,000 hours, what is the mean time of failure (MTTF)?arrow_forwardInorganic phosphorous is a naturally occurring element in all plants and animals, with concentrations increasing progressively up the food chain (fruit < vegetables < cereals < nuts < corpse). Geochemical surveys take soil samples to determine phosphorous content (in ppm, parts per million). A high phosphorous content may or may not indicate an ancient burial site, food storage site, or even a garbage dump. Independent random samples from two regions gave the following phosphorous measurements (in ppm). Assume the distribution of phosphorous is mound-shaped and symmetric for these two regions. Region I: x,; n, = 15 853 1,551 1,230 1,080 2,330 1,850 1,860 875 2,340 1,080 910 1,130 1,450 1,260 1,010 Region II: x,; n, = 14 540 1,230| 1,770 808 790 960 1,650 860 890 640 1,180 1,160 | 1,050 1,020 In USE SALT (a) Use a calculator with mean and standard deviation keys to verify that x,, S,, x2, and s,. (Round your answers to four decimal places.) x, = X1 ppm S1 ppm X2 ppm S2 , = ppm (b) Let…arrow_forwardThe toco toucan, the largest member of the toucan family, possesses the largest beak relative to body size of all birds. This exaggerated feature has received various interpretations, such as being a refined adaptation for feeding. However, the large surface area may also be an important mechanism for radiating heat (and hence cooling the bird) as outdoor temperature increases. Here are data for beak heat loss, as a percent of total body heat loss from all sources, at various temperatures in degrees Celsius. [Note: The numerical values in this problem have been modified for testing purposes.] Temperature (oC)(oC) 15 16 17 18 19 20 21 22 23 24 25 26 27 28 29 30 Percent heat loss from beak 33 32 33 32 39 43 56 48 44 49 44 56 58 60 60 63 The equation of the least-squares regression line for predicting beak heat loss, as a percent of total body heat loss from all sources, from temperature is: (Use decimal notation. Enter the values of the intercept and slope rounded to two…arrow_forward
- An article contained the following observations on degree of polymerization for paper specimens for which viscosity times concentration fell in a certain middle range: 416 421 422 423 426 428 430 434 437 439 446 447 449 453 456 462 464 Comment on any interesting features. (Select all that apply.) ___The data appears to be centered near 438. ___There are no outliers. ___There is little or no skew. ___There is one outlier. ___The data is strongly skewed. ___The data appears to be centered near 428 Calculate a two-sided 95% confidence interval for true average degree of polymerization. (Round your answers to two decimal places.) (____, ____)arrow_forwardPlease help me answer A.arrow_forwardAn article in Air and Waste ("Update on Ozone Trends in California's South Coast Air Basin," Vol. 43, 1993) studied the ozone levels on the South Coast air basin of California for the years 1976-1991. The author believes that the number of days that the ozone exceeds 0.20 parts per million depends on the seasonal meteorological index (the seasonal average 850 millibar temperature). The data follow: Year Days Index 16.3 1976 91 1977 105 17.1 1978 106 18.2 1979 108 18.1 1980 88 17.2 1981 91 18.2 1982 58 16.0 1983 82 17.2 Round your answers to 2 decimal places. (a) Fit a simple linear regression model to the data. Test for significance of regression using a = 0.05. y = i Calculate fo: i Year Days Index 1984 82 17.7 1985 65 17.2 1986 61 16.9 1987 48 17.1 1988 61 18.2 1989 43 17.3 1990 33 17.5 1991 36 16.6 i + i Is the simple linear regression model significant? No. (b) Calculate a 95% confidence interval on the slope. ≤B₁ ≤i Xarrow_forward
- 2. The x values and standardized residuals for the chlorine flow/etch rate data of Exercise 52 (Section 12.4) are displayed in the accompanying table. Construct a stan- dardized residual plot and comment on its appearance. 1.50 2.00 2.50 x e* x e* 1.50 .31 3.00 .73 1.02 3.50 -1.36 -1.15 3.50 1.53 -1.23 4.00 .07 2.50 .23arrow_forwardEmissions of sulfur dioxide set off chemical changes in the atmosphere that result in "acid rain." The acidity of liquids is measured by pH on a scale of 0 to 14. Distilled water has pH 7.0, and lower pH values indicate acidity. Normal rain is somewhat acidic, so acid rain is sometimes defined as rainfall with a pH below 5.0. Suppose the pH of rain at one location varies among rainy days according to a Normal distribution with mean 5.30 and standard deviation 0.43. What proportion of rainy days have rainfall with pH below 5.0?arrow_forwardInorganic phosphorous is a naturally occurring element in all plants and animals, with concentrations increasing progressively up the food chain (fruit < vegetables < cereals < nuts < corpse). Geochemical surveys take soil samples to determine phosphorous content (in ppm, parts per million). A high phosphorous content may or may not indicate an ancient burial site, food storage site, or even a garbage dump. Independent random samples from two regions gave the following phosphorous measurements (in ppm). Assume the distribution of phosphorous is mound-shaped and symmetric for these two regions. Region I: x,; n, = 15 875 1,080 2,330 1,850 1,860 853 1,551 1,230 2,340 1,080 910 1,130 1,450 1,260 1,010 Region II: x,; n, = 14 540 808 790 1,230 1,770 960 1,650 860 890 640 1,180 1,160 1,050 | 1,020 In USE SALT (a) Use a calculator with mean and standard deviation keys to verify that x,, S,, x2, and s,. (Round your answers to four decimal places.) X1 ppm S. = ppm X2 ppm 52 ppm (b) Let u, be the…arrow_forward
arrow_back_ios
SEE MORE QUESTIONS
arrow_forward_ios
Recommended textbooks for you
- MATLAB: An Introduction with ApplicationsStatisticsISBN:9781119256830Author:Amos GilatPublisher:John Wiley & Sons Inc
 Probability and Statistics for Engineering and th...StatisticsISBN:9781305251809Author:Jay L. DevorePublisher:Cengage Learning
 Statistics for The Behavioral Sciences (MindTap C...StatisticsISBN:9781305504912Author:Frederick J Gravetter, Larry B. WallnauPublisher:Cengage Learning
  Elementary Statistics: Picturing the World (7th E...StatisticsISBN:9780134683416Author:Ron Larson, Betsy FarberPublisher:PEARSON
 The Basic Practice of StatisticsStatisticsISBN:9781319042578Author:David S. Moore, William I. Notz, Michael A. FlignerPublisher:W. H. Freeman
 Introduction to the Practice of StatisticsStatisticsISBN:9781319013387Author:David S. Moore, George P. McCabe, Bruce A. CraigPublisher:W. H. Freeman
MATLAB: An Introduction with Applications
Statistics
ISBN:9781119256830
Author:Amos Gilat
Publisher:John Wiley & Sons Inc
Probability and Statistics for Engineering and th...
Statistics
ISBN:9781305251809
Author:Jay L. Devore
Publisher:Cengage Learning
Statistics for The Behavioral Sciences (MindTap C...
Statistics
ISBN:9781305504912
Author:Frederick J Gravetter, Larry B. Wallnau
Publisher:Cengage Learning
Elementary Statistics: Picturing the World (7th E...
Statistics
ISBN:9780134683416
Author:Ron Larson, Betsy Farber
Publisher:PEARSON
The Basic Practice of Statistics
Statistics
ISBN:9781319042578
Author:David S. Moore, William I. Notz, Michael A. Fligner
Publisher:W. H. Freeman
Introduction to the Practice of Statistics
Statistics
ISBN:9781319013387
Author:David S. Moore, George P. McCabe, Bruce A. Craig
Publisher:W. H. Freeman