
ENGR.ECONOMIC ANALYSIS
14th Edition
ISBN: 9780190931919
Author: NEWNAN
Publisher: Oxford University Press
expand_more
expand_more
format_list_bulleted
Related questions
Question
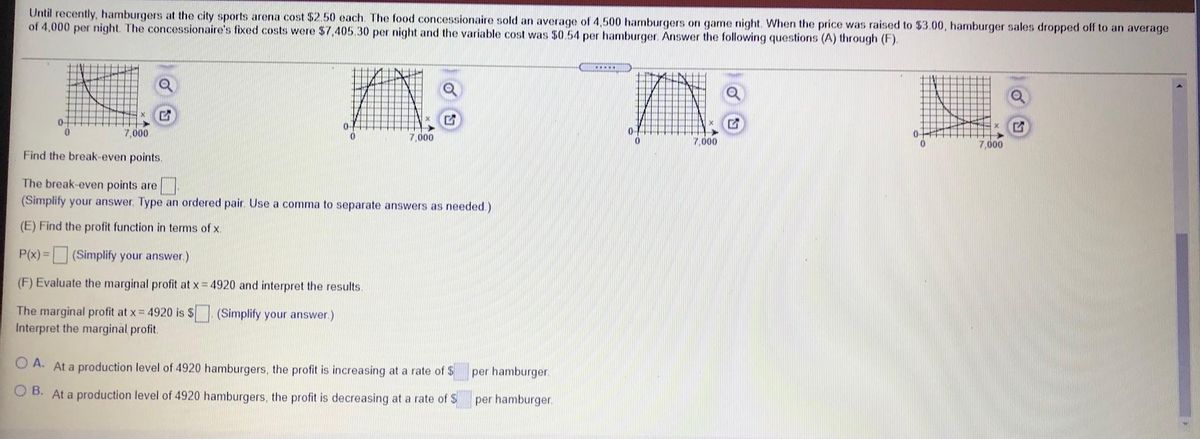

Transcribed Image Text:Until recently, hamburgers at the city sports arena cost $2.50 each. The food concessionaire sold an average of 4,500 hamburgers on game night. When the price was raised to $3.00, hamburger sales dropped off to an average
of 4,000 per night. The concessionaire's fixed costs were $7,405.30 per night and the variable cost was $0.54 per hamburger. Answer the following questions (A) through (F).
7,000
7,000
7,000
7,000
Find the break-even points.
The break-even points are
(Simplify your answer. Type an ordered pair. Use a comma to separate answers as needed.)
(E) Find the profit function in terms of x.
P(x) =
(Simplify your answer.)
(F) Evaluate the marginal profit at x = 4920 and interpret the results.
The marginal profit at x = 4920 is $
Interpret the marginal profit.
(Simplify your answer)
O A. At a production level of 4920 hamburgers, the profit is increasing at a rate of $
per hamburger.
O B. At a production level of 4920 hamburgers, the profit is decreasing at a rate of S
per hamburger.

Transcribed Image Text:Until recently, hamburgers at the city sports arena cost $2.50 each. The food concessionaire sold an average of 4,500 hamburgers on game night. WWhen the price was raised to $3.00, hamburger sales dropped off to an averag
of 4,000 per night. The concessionaire's fixed costs were $7,405.30 per night and the variable cost was $0.54 per hamburger. Answer the following questions (A) through (F).
(A) Assume that the relationship between price p and demand x is linear. Express p as a function of x and find the domain of this function.
.....
(Simplify your answer.)
The domain of p is (Type a compound inequality.)
(B) Find the revenue function in terms of x and state its domain.
R(x) = (Simplify your answer.)
The domain of R(x) is (Type a compound inequality.)
(C) Assume that the cost function is linear. Express the cost function in terms of x.
C(x) = (Simplify your answer.)
(D) Graph the cost function and the revenue function in the same coordinate system. Choose the correct graph below.
O A.
B.
OC.
O D.
ARC
12,500-
ARC
12.500-
ARC
12.500-
ARC
12.500-
0-
7,000
0-
0-
7,000
7.000
0-
7.000
Expert Solution
This question has been solved!
Explore an expertly crafted, step-by-step solution for a thorough understanding of key concepts.

This is a popular solution

Trending nowThis is a popular solution!

Step by stepSolved in 2 steps

Knowledge Booster


Learn more about
Need a deep-dive on the concept behind this application? Look no further. Learn more about this topic, economics and related others by exploring similar questions and additional content below.Similar questions
- A new machine comes with 200 free service hours over the first year. Additional time costs $150 per hour. What are the average costs per hour for the quantities of 55? Answer:arrow_forwardCan you answer c and d?arrow_forwardThe IT department allocates indirect costs to user departments on the basis of CPU time at the rate of $2000 per second. For the first quarter, the two heaviest use departments logged 900 and 1300 seconds, respectively. If the IT indirect budget for the year is $19.56 million, the percentage of this year’s allocation consumed by these departments is closest to: (a) 22.5% (b) 32% (c) 55% (d) 67%arrow_forward
- Your friend Claire has been designing her own hoodies and giving them as gifts to friends and family. She has decided to sell them online soon by using a 3rd party website with a service surcharge based on her pricing. Using the information below, what is relationship between Claire's selling price per hoodie and profit margin? (Please choose from the image options presented, otherwise feel free to plot a graph of your own) Costs ($) Base Hoodie Cost $30 Craft Supplies to Design $10 Selling Website Service Charge 5%arrow_forwardFor the following problem, what would be the objective function that aims at minimizing the total cost considering that X1, X2, X3, and X4 are the number of units produced and sold of Products 1, 2, 3, and 4, respectively? Manufacturing time (hr) per unit Machine Cost per hr ($) Product 1 Product 2 Product 3 Product 4 Capacity (hr). 10 2 4 2 500 5 3 1 2 380 4 7 1 450 Unit selling price ($) 75 45 O a. 20X1+30X2+40X3+20X4 O b. None of the answers OC. 75X1+70X2+55X3+45X4 Od. 63X1+52X2+53X3+34X4 123 دي دا فيا 70 2 55arrow_forwardAntoine rents rooms in his hotel for an average of $100 per night. The variable cost per rented room is $20, to cover maid service and utilities. His fixed costs are $100,000 and his profit last year was $20,000. For Antoine, the contribution per unit is $100 $80 $1005 $800arrow_forward
- The Barnes Center started selling first-aid kits for students in the pharmacy! When 300 first-aid kits are produced, the average cost is $10 and the marginal cost is $15. Estimate the cost of producing 301 first-aid kits.arrow_forwardproduction function is Q = An orange grower has discovered a process for producing oranges that requires two inputs. The min{2x1, x2}, where x₁ and x2 are the amounts of inputs 1 and 2 that he uses. The prices of these two inputs are w₁ = 5 and w₂ = = 2, respectively. The minimum cost of producing 140 units is (a) $980 (b) $630 (c) $1400 (d) $280 (e) $700arrow_forwardA group can charter a particular aircraft at a fixed total cost. If 36 people charter the aircraft rather than 40 people, then the cost per person is greater by $12. Whatis the fixed total cost, in dollars, to charter the aircraft?arrow_forward
- The total cost a power plant ($/megawatts) to produce electricity is Y=12+1.3X+0.24 X2 , where X is in megawatts. The estimated selling price of electricity is (16-0.23X) per megawatts. Find the value of X that maximizes profit. Group of answer choices Less than 10 megawatts Between 10-12 megawatts Between 12-14 megawatts More than 14 megawatts Dontarrow_forwardMirtha owns an online jewelry store that specializes in earrings. In March, she sells 50 pairs of earrings priced at $15. The cost of materials to create the 50 pairs of earrings was $100. The website she uses to sell her wares costs her $10 a month, and she is also charged 4% on each sale by the company that processes debit/credit card purchases. Which of the following best represents Mirth’s total cost? Group of answer choices A)The $750 Mirtha earned from earring sales minus the materials ($100), online website charge ($10), and payment processing charge (4%) B)The sum of the materials ($100), website charge ($10), and 4% payment processing charge (4%) C)The cost of all the materials used to create the earrings, $100 D)The costs of materials minus the costs it takes to run her business through the online store, in this case the $10 website charges and the 4% payment processing chargearrow_forwardA study of 86 savings and loan associations in six northwestern states yielded the following cost function. C� = 3.69 - 0.007999Q� + 0.000005359Q2�2 + 25.0X1�1 (3.69) (3.08) (3.42) (3.50) where C� = average operating expense ratio, expressed as a percentage and defined as total operating expense ($ million) divided by total assets ($ million) times 100 percent. Q� = output; measured by total assets ($ million) X1�1 = ratio of the number of branches to total assets ($ million) Note: The number in parentheses below each coefficient is its respective t-statistic. Holding constant the effects of bank branching (X1�1), what is the level of total assets that minimizes the average operating expense ratio? $746.31 million $1,562.70 million $1,492.63 million $461.31 million What is the average operating expense ratio for a savings and loan association with the level of total assets determined in the previous part and 1 branch?…arrow_forward
arrow_back_ios
SEE MORE QUESTIONS
arrow_forward_ios
Recommended textbooks for you
 Principles of Economics (12th Edition)EconomicsISBN:9780134078779Author:Karl E. Case, Ray C. Fair, Sharon E. OsterPublisher:PEARSON
 Engineering Economy (17th Edition)EconomicsISBN:9780134870069Author:William G. Sullivan, Elin M. Wicks, C. Patrick KoellingPublisher:PEARSON
 Principles of Economics (MindTap Course List)EconomicsISBN:9781305585126Author:N. Gregory MankiwPublisher:Cengage Learning
 Managerial Economics: A Problem Solving ApproachEconomicsISBN:9781337106665Author:Luke M. Froeb, Brian T. McCann, Michael R. Ward, Mike ShorPublisher:Cengage Learning
 Managerial Economics & Business Strategy (Mcgraw-...EconomicsISBN:9781259290619Author:Michael Baye, Jeff PrincePublisher:McGraw-Hill Education
Principles of Economics (12th Edition)
Economics
ISBN:9780134078779
Author:Karl E. Case, Ray C. Fair, Sharon E. Oster
Publisher:PEARSON
Engineering Economy (17th Edition)
Economics
ISBN:9780134870069
Author:William G. Sullivan, Elin M. Wicks, C. Patrick Koelling
Publisher:PEARSON
Principles of Economics (MindTap Course List)
Economics
ISBN:9781305585126
Author:N. Gregory Mankiw
Publisher:Cengage Learning
Managerial Economics: A Problem Solving Approach
Economics
ISBN:9781337106665
Author:Luke M. Froeb, Brian T. McCann, Michael R. Ward, Mike Shor
Publisher:Cengage Learning
Managerial Economics & Business Strategy (Mcgraw-...
Economics
ISBN:9781259290619
Author:Michael Baye, Jeff Prince
Publisher:McGraw-Hill Education