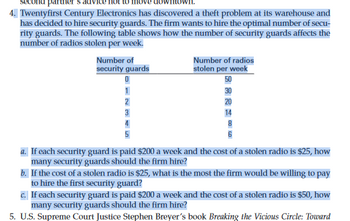
Twentyfirst Century Electronics has discovered a theft problem at its warehouse and has decided to hire security guards. The firm wants to hire the optimal number of security guards. The following table shows how the number of security guards affects the number of radios stolen per week.
|
Number of security guards
|
Number of radios stolen per week |
|
0 |
50 |
|
1 |
30 |
|
2 |
20 |
|
3 |
14 |
|
4 |
8 |
|
5 |
6 |
a- If each security guard is paid $200 a week and the cost of a stolen radio is $25, how
many security guards should the firm hire?
b. If the cost of a stolen radio is $25, what is the most the firm would be willing to pay
to hire the first security guard?
c. If each security guard is paid $200 a week and the cost of a stolen radio is $50, how
many security guards should the firm hire

Trending nowThis is a popular solution!
Step by stepSolved in 2 steps

Why is the calculation of the total cost is wrong. The below is the right numbers but it is different from the solution given and if it comes down to this, will it be 2 or 3 security guards to employ to minimize the loss?
50*25 = 1250
30*25 = 750
20*25 = 500
14*25 = 350
Please provide clarification and provide the correct solutiob
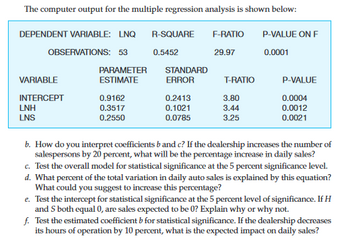
4- The manager of Collins Import Autos believes the number of cars sold in a day(Q) depends on two factors: (1) the number of hours the dealership is open (H) and (2) the number of salespersons working that day (S ). After collecting data for two months (53 days), the manager estimates the following log-linear model:
Q = aHbSc
-----
a. Explain how to transform this log-linear model into a linear form that can be estimated using multiple regression analysis.
b. How do you interpret coefficients b and c? If the dealership increases the number of salespersons by 20 percent, what will be the percentage increase in daily sales?
c. Test the overall model for statistical significance at the 5 percent significance level.

- Please help!! Barbara is an economist researcher and commentator. The Eco Books Ltd offers her $13,000 for writing a book about economics principles. Barbara has never written a book about economics principles, but accepts the offer and writes the economics book called 'Principles of Economics'. She assigns the book's copyright for $13,400 to The Eco Books Ltd. The book is published and she is paid. She also sells the book's manuscript to the Eco Books Ltd's library for $4,350 plus several interview manuscripts she has collected while writing the economics book for which she receives $3,200. Discuss each of the above payments to Barbara separately and states if these are income from Barbara's personal exertion. Would your answer differ if Barbara wrote the Principles of Economics' book before signing a contract with The Eco Books Ltd in her spare time and only decided to sell it later? Support your answer by referring to relevant statutory and case law.arrow_forwardA weaver working with a handloom is able to produce 11 yards of fabric per day. The typical weaver is paid £10 for a day's work. A loom powered by a steam engine is able to produce 82 yards of fabric per day. The powered loom still needs a worker to operate it, earning £10 per day, but also needs 24 pounds of coal to power it. At what price per pound of coal does the cost of producing fabric by power loom equal the cost of producing it by handloom? Round your final answer to two decimal places.arrow_forwardKris wants to open a BBQ restaraunt. He has signed a 12- month lease at $6,000 per month. The lease enabled him to rent a restaraunt with all the equipment he needs to make BBQ; therefore, K equals 1. Kris must pay his workers a monthly salary of $2,400 each. His production function is q = 100L1/2K1/2 where q is the quantity of BBQ prepared per month in pounds, L is the number of workers employed per month, and K is the quantity of capital employed, and, as previously indicated, K is assumed to equal 1. What does Kris's monthly total cost expressed as a function of quantity equal?arrow_forward
- A real estate company has 18 houses listed for sale by their clients. In how many ways can 3 of the 18 houses be selected to be featured in an advertising brochures?arrow_forwardA toll road commission is planning to locate garages for tow trucks along a 94-mile circular highway. Each garage has a fixed cost of $4,500 per day. Towing jobs are equally likely along any point of the highway, and cost per mile towed is $47. If there were 4,500 towing jobs per day, what number of garages would minimize the sum of the fixed costs and towing costs? Instructions: Enter your answer as a whole number. garagesarrow_forwardwhat is the easiest and simplest way to do this cost minimization problem for substitutes (and graph if you can)arrow_forward
- I got the graph correct, but what am I doing wrong to get the two equarrow_forwardA farmer’s fields are right next to the train tracks, where sparks from the trains set the field on fire. The railroad profit from running zero, one, two or three trains is shown below. The columns indicate the number of trains running. Total railroad profits are the total profits to the railroad from running the specified number of trains. Total lost farmer profits are total profits the farmer loses from a specified number of trains running. Trains 0 1 2 3 Total Railroad Profit. $200 $300 $350 $410Total Lost Profit for Farmer $0 $100 $125 $300 1) If a court grants the railroad the property right throw sparks, and transaction costs are $1400 (split evenly by the…arrow_forwardCan you more detailed explain and write this part : Cost is minimized at the point where profit is maximized . Profit = R - C = q2+14q+20 - 2q2 + 8q - 15 Profit maximizing point : d(Profit )/dq = 0 => -2q + 22 = 0 ( especially i don't understand this part !!!!) q* = 11 (Cost minimizing level of production )arrow_forward
- i need the answer quicklyarrow_forwardFive fishermen live in a village and have no other employment or income earning possibilities besides fishing. They each own a boat that is suitable for fishing, but does not have any resale value. Fish are worth $5 per pound and the marginal cost of operating the boat is $500 per month. They all fish in a river next to the village, and they have determined that when there are more of them out there on the river fishing, they each catch less fish per month according to the following schedule: Boats Fish Caught per Boat (pounds) 200 190 175 155 130 If each fisherman acts in his own best interest, his average cost is the same as $ continue operating his boat as long as his . Thus, there will be 1 2 345 Each fisherman will is positive. If he catches 130 fish, his profit is boats in the river.arrow_forwardConsider an airline's decision about whether to cancel a particular flight that hasn't sold out. The following table provides data on the total cost of operating a 100-seat plane for various numbers of passengers. Total Cost Number of Passengers (Dollars per flight) 40,000 10 60,000 20 65,000 30 68,000 40 70,000 50 71,000 60 72,500 70 73,500 80 74,000 90 74,300 100 74,500 Given the information presented in the previous table, the fixed cost to operate this flight is s At each ticket price, a different number of consumers will be willing to purchase tickets for this flight. Assume that the price of a flight is fixed for the duration of ticket sales. Use the previous table as well as the following demand schedule to complete the questions that follow. Price Quantity Demanded (Dollars per ticket) (Tickets per flight) 1,000 700 30 400 90 200 100arrow_forward

 Principles of Economics (12th Edition)EconomicsISBN:9780134078779Author:Karl E. Case, Ray C. Fair, Sharon E. OsterPublisher:PEARSON
 Engineering Economy (17th Edition)EconomicsISBN:9780134870069Author:William G. Sullivan, Elin M. Wicks, C. Patrick KoellingPublisher:PEARSON
 Principles of Economics (MindTap Course List)EconomicsISBN:9781305585126Author:N. Gregory MankiwPublisher:Cengage Learning
 Managerial Economics: A Problem Solving ApproachEconomicsISBN:9781337106665Author:Luke M. Froeb, Brian T. McCann, Michael R. Ward, Mike ShorPublisher:Cengage Learning
 Managerial Economics & Business Strategy (Mcgraw-...EconomicsISBN:9781259290619Author:Michael Baye, Jeff PrincePublisher:McGraw-Hill Education


