
MATLAB: An Introduction with Applications
6th Edition
ISBN: 9781119256830
Author: Amos Gilat
Publisher: John Wiley & Sons Inc
expand_more
expand_more
format_list_bulleted
Related questions
Concept explainers
Topic Video
Question

Transcribed Image Text:TRY IT 4.1
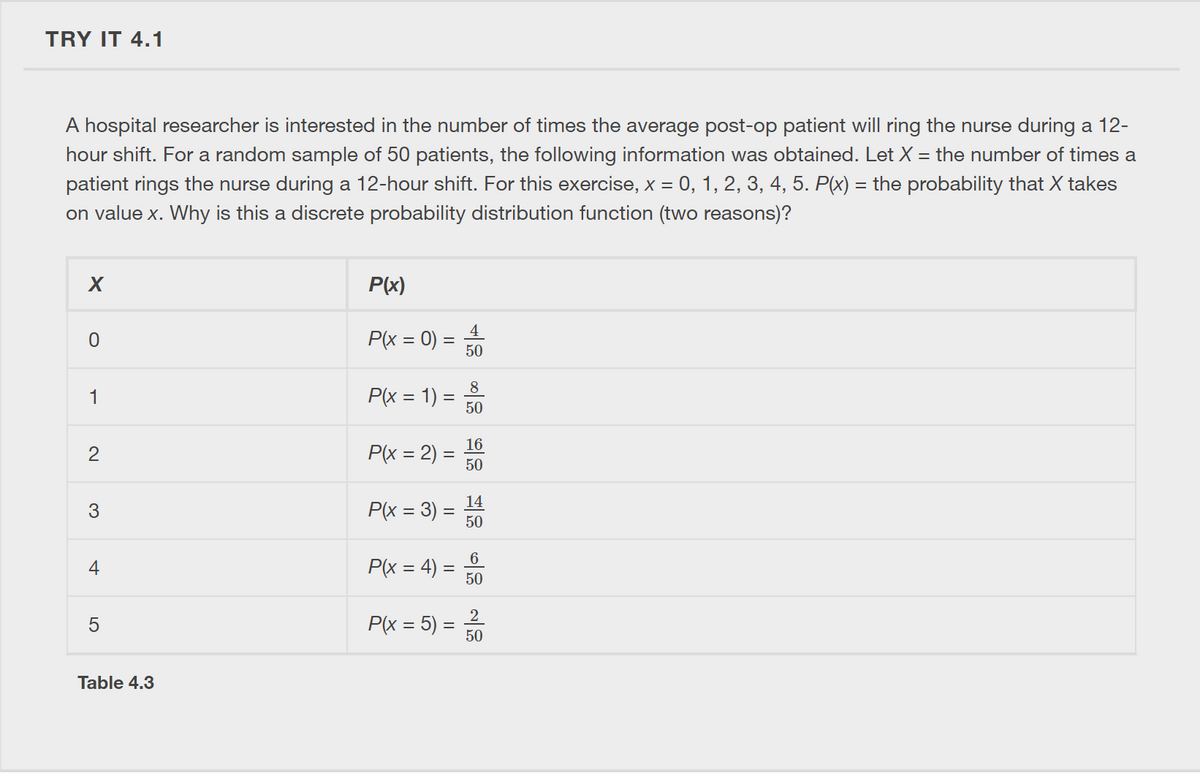
A hospital researcher is interested in the number of times the average post-op patient will ring the nurse during a 12-
hour shift. For a random sample of 50 patients, the following information was obtained. Let X = the number of times a
patient rings the nurse during a 12-hour shift. For this exercise, x = 0, 1, 2, 3, 4, 5. P(x) = the probability that X takes
on value x. Why is this a discrete probability distribution function (two reasons)?
P(x)
4
P(x = 0) =
50
8
1
P(x = 1) =
50
16
2
P(x = 2) =
50
14
P(x = 3) =
50
6
4
P(x = 4) =
50
5
P(x = 5) =
50
Table 4.3
3.
LO
Expert Solution
This question has been solved!
Explore an expertly crafted, step-by-step solution for a thorough understanding of key concepts.

This is a popular solution

Trending nowThis is a popular solution!

Step by stepSolved in 2 steps

Knowledge Booster


Learn more about
Need a deep-dive on the concept behind this application? Look no further. Learn more about this topic, statistics and related others by exploring similar questions and additional content below.Similar questions
- for a two tailed test, if z=2.04, find the p valuearrow_forward18 A sample of n=8 scores has a mean of M=12. One new score is added to the sample and the new mean is found to be M=13. What is the value of the new score?arrow_forwardSuppose that the speed at which cars go on the freeway is normally distributed with mean 78 mph and standard deviation 6 miles per hour. Let X be the speed for a randomly selected car. Round all answers to 4 decimal places where possible. b. If one car is randomly chosen, find the probability that it is traveling more than 76 mph. __________c. If one of the cars is randomly chosen, find the probability that it is traveling between 77 and 80 mph. ___________d. 60% of all cars travel at least how fast on the freeway?_____________ mph.arrow_forward
- A psychologist found a study which claiming that 32% of patients who visit a psychologist have symptoms of anxiety. This psychologist had 44 patients visit. Let x = the number of patients that had symptoms of anxiety. (a) The random variable is which of the following? O the number of psychologists O the number of patients who visited the psychologist the number of patients who had symptoms of anxiety O the number of patients without symptoms of anxiety (b) How many total patients did the psychologist have visit?arrow_forwardSuppose that 75%75% of college students prefer pepperoni on their pizzas. You took a sample of ?=150n=150 at your college and found that 70%70% said they want pepperoni on their pizzas. You want to know if your college is different from the rest at the 10%10% level. What is the ?P‑value for this test?arrow_forwardBighorn sheep are beautiful wild animals found throughout the western United States. Let x be the age of a bighorn sheep (in years), and let y be the mortality rate (percent that die) for this age group. For example, x = 1, y = 14 means that 14% of the bighorn sheep between 1 and 2 years old died. A random sample of Arizona bighorn sheep gave the following information: x 1 2 3 4 5 y 15.8 17.3 14.4 19.6 20.0 Σx = 15; Σy = 87.1; Σx2 = 55; Σy2 = 1,540.45; Σxy = 272 (a) Find x, y, b, and the equation of the least-squares line. (Round your answers for x and y to two decimal places. Round your least-squares estimates to three decimal places.) x = y = b = ŷ = + x (b) Draw a scatter diagram for the data. Plot the least-squares line on your scatter diagram. (c) Find the sample correlation coefficient r and the coefficient of determination r2. (Round your answers to three decimal places.) r = r2 = What percentage of variation in y is…arrow_forward
- In a computer instant messaging survey, respondents were asked to choose the most fun way to flirt, and it found that P(D) = 0.750, where D is directly in person. If someone is randomly selected, what does P (D) represent, and what is its value? What does P (D represent? O A. P(D) is the probability of randomly selecting someone who did not participate in the survey. B. P(D) is the probability of randomly selecting someone who chooses a direct in-person encounter as the most fun way to flirt. C. P(D) is the probability of randomly selecting someone who did not have a preference in regards to the most fun way to flirt. D. P(D) is the probability of randomly selecting someone who does not choose a direct in-person encounter as the most fun way to flirt.arrow_forwardBighorn sheep are beautiful wild animals found throughout the western United States. Let x be the age of a bighorn sheep (in years), and let y be the mortality rate (percent that die) for this age group. For example, x = 1, y = 14 means that 14% of the bighorn sheep between 1 and 2 years old died. A random sample of Arizona bighorn sheep gave the following information: x 1 2 3 4 5 y 15.8 17.3 14.4 19.6 20.0 Σx = 15; Σy = 87.1; Σx2 = 55; Σy2 = 1,540.45; Σxy = 272 (a) Find x, y, b, and the equation of the least-squares line. (Round your answers for x and y to two decimal places. Round your least-squares estimates to three decimal places.) x = y = b = ŷ = + xarrow_forwardSuppose that a college determines the following distribution for X = number of courses taken by a full-time student this semester: Value of X 3 Probability 0.07 4 5 6 0.25 0.28 The probability for X = 4 is missing. What is it? 0.07 0.25 0.40 0.50arrow_forward
arrow_back_ios
arrow_forward_ios
Recommended textbooks for you
- MATLAB: An Introduction with ApplicationsStatisticsISBN:9781119256830Author:Amos GilatPublisher:John Wiley & Sons Inc
 Probability and Statistics for Engineering and th...StatisticsISBN:9781305251809Author:Jay L. DevorePublisher:Cengage Learning
 Statistics for The Behavioral Sciences (MindTap C...StatisticsISBN:9781305504912Author:Frederick J Gravetter, Larry B. WallnauPublisher:Cengage Learning
  Elementary Statistics: Picturing the World (7th E...StatisticsISBN:9780134683416Author:Ron Larson, Betsy FarberPublisher:PEARSON
 The Basic Practice of StatisticsStatisticsISBN:9781319042578Author:David S. Moore, William I. Notz, Michael A. FlignerPublisher:W. H. Freeman
 Introduction to the Practice of StatisticsStatisticsISBN:9781319013387Author:David S. Moore, George P. McCabe, Bruce A. CraigPublisher:W. H. Freeman
MATLAB: An Introduction with Applications
Statistics
ISBN:9781119256830
Author:Amos Gilat
Publisher:John Wiley & Sons Inc
Probability and Statistics for Engineering and th...
Statistics
ISBN:9781305251809
Author:Jay L. Devore
Publisher:Cengage Learning
Statistics for The Behavioral Sciences (MindTap C...
Statistics
ISBN:9781305504912
Author:Frederick J Gravetter, Larry B. Wallnau
Publisher:Cengage Learning
Elementary Statistics: Picturing the World (7th E...
Statistics
ISBN:9780134683416
Author:Ron Larson, Betsy Farber
Publisher:PEARSON
The Basic Practice of Statistics
Statistics
ISBN:9781319042578
Author:David S. Moore, William I. Notz, Michael A. Fligner
Publisher:W. H. Freeman
Introduction to the Practice of Statistics
Statistics
ISBN:9781319013387
Author:David S. Moore, George P. McCabe, Bruce A. Craig
Publisher:W. H. Freeman