MATLAB: An Introduction with Applications
6th Edition
ISBN: 9781119256830
Author: Amos Gilat
Publisher: John Wiley & Sons Inc
expand_more
expand_more
format_list_bulleted
Concept explainers
Question
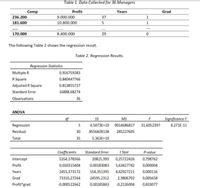
Training Dept. of Nimrod Inc wants to develop a regression-based compensation model (compensation in $ per year, Comp) for its mid-level managers to encourage performance, loyalty, and continuing education based on three variables.
▪ Business unit-profitability (Profit per year in $).
▪ Working experiences in Nimrod Inc (Years).
▪ Whether or not a manager has a graduate degree (Grads). If a manager has a graduate degree equals 1, 0 otherwise.
Table Attached
Question:
Interpret the coefficient of determination of the regression-based compensation model.

Transcribed Image Text:Table 1. Data Collected for 36 Managers
Comp
Profit
Years
Grad
236.200
9.000.000
37
181.600
10.800.000
1
170.000
8.400.000
29
The following Table 2 shows the regression result.
Table 2. Regression Results.
Regression Statistics
Multiple R
0,916759383
R Square
0,840447766
Adjusted R Square
0,813855727
Standard Error
16888,68274
Observations
36
ANOVA
df
SS
MS
Significance F
Regression
5
4,5073E+10 9014686817 31,6052397
4,271E-11
Residual
30
8556828138
285227605
Total
35
5,363E+10
Coefficients
Standard Error
t Stat
P-value
Intercept
5354,378366
20815,993
0,25722426
0,798762
Profit
0,010315404
0,00183083
5,63427742
0,000004
Years
2455,373172
554,351395 4,42927211
0,000116
Grad
73310,27264
24595,2312
2,9806702
0,005658
Profit*grad
-0,000522662
0,00245843
-0,2126004
0,833077
Expert Solution
This question has been solved!
Explore an expertly crafted, step-by-step solution for a thorough understanding of key concepts.
Step by stepSolved in 2 steps

Knowledge Booster
Learn more about
Need a deep-dive on the concept behind this application? Look no further. Learn more about this topic, statistics and related others by exploring similar questions and additional content below.Similar questions
- how you will calculate the degrees of freedom in multiple linear regression and in simple linear regression?arrow_forwardA county real estate appraiser wants to develop a statistical model to predict the appraised value of houses in a section of the county called East Meadow. One of the many variables thought to be an important predictor of appraised value is the number of rooms in the house. Consequently, the appraiser decided to fit the simple linear regression model, y = b₁x + bowhere y = appraised value of the house (in $thousands) and x = number of rooms. Using data collected for a sample of n=74 houses in East Meadow, the following results were obtained: y=74.80+ 17.80x Give a practical interpretation of the estimate of the slope of the least squares line. For each additional room in the house, we estimate the appraised value to increase $74,800. 1000 For each additional dollar of appraised value, we estimate the number of rooms in the house to increase by 17.80 rooms. For a house with 0 rooms, we estimate the appraised value to be $74,800. For each additional room in the house, we estimate the…arrow_forwardGive an example of how a nonrepresentative sample can severely affect a regression analysis.arrow_forward
- Ordinal data cannot be analyzed using regression analysis. True Falsearrow_forwardHow does utilizing linear regression benefit or help a business?arrow_forwardTo properly examine the effect of a categorical independent variable in a multiple linear regression model we use an interaction term. True O Falsearrow_forward
- Please help me this question.arrow_forwardWe have data from 209 publicly traded companies (circa 2010) indicating sales and compensation information at the firm-level. We are interested in predicting a company's sales based on the CEO's salary. The variable sales; represents firm i's annual sales in millions of dollars. The variable salary; represents the salary of a firm i's CEO in thousands of dollars. We use least-squares to estimate the linear regression sales; = a + ßsalary; + ei and get the following regression results: . regress sales salary Source Model Residual Total sales salary cons SS 337920405 2.3180e+10 2.3518e+10 df 1 207 208 Coef. Std. Err. .9287785 .5346574 5733.917 1002.477 MS 337920405 111980203 113066454 Number of obs F (1, 207) Prob > F R-squared t P>|t| = Adj R-squared = Root MSE 1.74 0.084 5.72 0.000 = = -.1252934 3757.543 = 209 3.02 0.0838 0.0144 0.0096 10582 [95% Conf. Interval] 1.98285 7710.291 This output tells us the regression line equation is sales = 5,733.917 +0.9287785 salary. Interpret the…arrow_forward
arrow_back_ios
arrow_forward_ios
Recommended textbooks for you
 MATLAB: An Introduction with ApplicationsStatisticsISBN:9781119256830Author:Amos GilatPublisher:John Wiley & Sons Inc
 Probability and Statistics for Engineering and th...StatisticsISBN:9781305251809Author:Jay L. DevorePublisher:Cengage Learning
 Statistics for The Behavioral Sciences (MindTap C...StatisticsISBN:9781305504912Author:Frederick J Gravetter, Larry B. WallnauPublisher:Cengage Learning
 Elementary Statistics: Picturing the World (7th E...StatisticsISBN:9780134683416Author:Ron Larson, Betsy FarberPublisher:PEARSON
 The Basic Practice of StatisticsStatisticsISBN:9781319042578Author:David S. Moore, William I. Notz, Michael A. FlignerPublisher:W. H. Freeman
 Introduction to the Practice of StatisticsStatisticsISBN:9781319013387Author:David S. Moore, George P. McCabe, Bruce A. CraigPublisher:W. H. Freeman

MATLAB: An Introduction with Applications
Statistics
ISBN:9781119256830
Author:Amos Gilat
Publisher:John Wiley & Sons Inc

Probability and Statistics for Engineering and th...
Statistics
ISBN:9781305251809
Author:Jay L. Devore
Publisher:Cengage Learning

Statistics for The Behavioral Sciences (MindTap C...
Statistics
ISBN:9781305504912
Author:Frederick J Gravetter, Larry B. Wallnau
Publisher:Cengage Learning

Elementary Statistics: Picturing the World (7th E...
Statistics
ISBN:9780134683416
Author:Ron Larson, Betsy Farber
Publisher:PEARSON

The Basic Practice of Statistics
Statistics
ISBN:9781319042578
Author:David S. Moore, William I. Notz, Michael A. Fligner
Publisher:W. H. Freeman

Introduction to the Practice of Statistics
Statistics
ISBN:9781319013387
Author:David S. Moore, George P. McCabe, Bruce A. Craig
Publisher:W. H. Freeman