
MATLAB: An Introduction with Applications
6th Edition
ISBN: 9781119256830
Author: Amos Gilat
Publisher: John Wiley & Sons Inc
expand_more
expand_more
format_list_bulleted
Related questions
Question

Transcribed Image Text:merk Mat At & Saar M Math 2301-007 CN 10604,
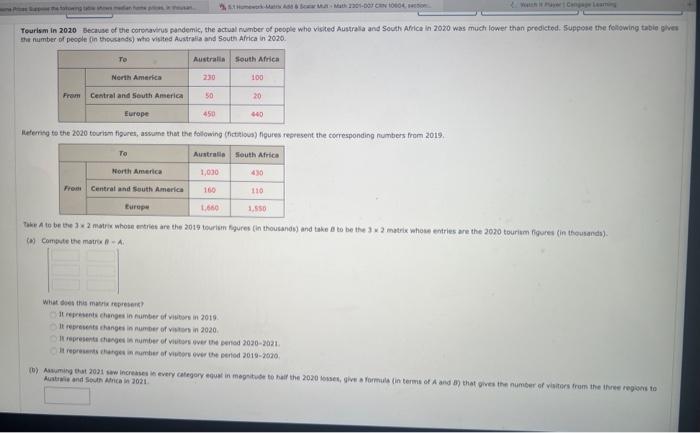
Tourism in 2020 Because of the coronavirus pandemic, the actual number of people who visited Australia and South Africa in 2020 was much lower than predicted. Suppose the following table gives
the number of people (in thousands) who visited Australia and South Africa in 2020.
To
North America
To
North America
From Central and South America
Europe
Australia
230
From Central and South America
Europe
Referring to the 2020 tourism figures, assume that the following (fictitious) figures represent the corresponding numbers from 2019.
Australia South Africa
1,030
160
What does this matrix represent?
50
450
South Africa
100
It represents changes in number of visitors in 2019.
It represents changes in number of visitors in 2020.
20
440
430
1,660
Take A to be the 3x2 matrix whose entries are the 2019 tourism figures (in thousands) and take to be the 3 x 2 matrix whose entries are the 2020 tourism figures (in thousands).
(a) Compute the matrix - A
110
1,550
It represents changes in number of visitors over the period 2020-2021.
It represents changes in number of visitors over the period 2019-2020
(b) Assuming that 2021 saw increases in every category equal in magnitude to half the 2020 losses, give a formula (in terms of A and 8) that gives the number of visitors from the three regions to
Australia and South Africa in 2021.
Expert Solution
This question has been solved!
Explore an expertly crafted, step-by-step solution for a thorough understanding of key concepts.

This is a popular solution

Trending nowThis is a popular solution!

Step by stepSolved in 3 steps with 8 images

Knowledge Booster

Similar questions
- *42. Smartphone Ownership. The Pew Internet & American Life Project compiles data on smartphone ownership and publishes the results in the document Smartphone Ownership. The first two columns of the following table provide a percentage distribution for age of U.S. adults. The third column of the table shows the percentage of people in each age group who own a smartphone. Age group (years) Percentage of adults Percentage who own a smartphone 18–24 12.5 79 25–34 18.0 81 35-44 16.7 69 45–54 17.5 55 55–64 16.4 39 65+ 18.9 18 Suppose that a U.S. adult is selected at random. Determine the prob- ability that the person selected a. owns a smartphone, given that he or she is between 18 and 24 years old.arrow_forward5. The graph below shows the LFPR for 25-54 year old men over several decades. Percent 100 May-16 98 96 94 92 90 88 86 1948 1954 1960 1966 1972 1978 1984 1990 1996 2002 2008 2014 Source: Bureau of Labor Statistics, Current Population Survey; CEA calculations. (Source: Voxeu.org) It shows that the fraction of these "prime working age men" who are NOT in the labor forced has a. doubled b. tripled c. quadrupled d. not changedarrow_forwardThe table below shows the alcohol consumption per capita for seventeen high-income countries in 2000 according to https://ourworldindata.org. Country Liters of Alcohol Consumption per Capita in 1980 Australia 9.7Austria 11.1Belgium 11.5Canada 7.6Denmark 9.8Finland 5.1France 13.3Germany 12.7Italy 10.8Japan 6.5Netherlands 8.6New Zealand 9.1Norway 5.2Sweden 5.9Switzerland 11.4United Kingdom 8United States 7.7 1) Calculate the mean, median, mode, and standard deviation of the liters of alcohol consumption per capita for these 17 countries. Use your TI-84 calculator or Excel as necessary. If you calculate them by hand, include your work (neatly written on a separate sheet of paper!!). If you use Excel, include the Excel worksheet. If you use your TI-84, show what you’ve entered and the results you get. (You could take photos of your calculator and include those if you’d rather.)Mean = _______________________ (Round to 1 decimal place.)Median = ______________________Mode(s) =…arrow_forward
arrow_back_ios
arrow_forward_ios
Recommended textbooks for you
- MATLAB: An Introduction with ApplicationsStatisticsISBN:9781119256830Author:Amos GilatPublisher:John Wiley & Sons Inc
 Probability and Statistics for Engineering and th...StatisticsISBN:9781305251809Author:Jay L. DevorePublisher:Cengage Learning
 Statistics for The Behavioral Sciences (MindTap C...StatisticsISBN:9781305504912Author:Frederick J Gravetter, Larry B. WallnauPublisher:Cengage Learning
  Elementary Statistics: Picturing the World (7th E...StatisticsISBN:9780134683416Author:Ron Larson, Betsy FarberPublisher:PEARSON
 The Basic Practice of StatisticsStatisticsISBN:9781319042578Author:David S. Moore, William I. Notz, Michael A. FlignerPublisher:W. H. Freeman
 Introduction to the Practice of StatisticsStatisticsISBN:9781319013387Author:David S. Moore, George P. McCabe, Bruce A. CraigPublisher:W. H. Freeman
MATLAB: An Introduction with Applications
Statistics
ISBN:9781119256830
Author:Amos Gilat
Publisher:John Wiley & Sons Inc
Probability and Statistics for Engineering and th...
Statistics
ISBN:9781305251809
Author:Jay L. Devore
Publisher:Cengage Learning
Statistics for The Behavioral Sciences (MindTap C...
Statistics
ISBN:9781305504912
Author:Frederick J Gravetter, Larry B. Wallnau
Publisher:Cengage Learning
Elementary Statistics: Picturing the World (7th E...
Statistics
ISBN:9780134683416
Author:Ron Larson, Betsy Farber
Publisher:PEARSON
The Basic Practice of Statistics
Statistics
ISBN:9781319042578
Author:David S. Moore, William I. Notz, Michael A. Fligner
Publisher:W. H. Freeman
Introduction to the Practice of Statistics
Statistics
ISBN:9781319013387
Author:David S. Moore, George P. McCabe, Bruce A. Craig
Publisher:W. H. Freeman