
MATLAB: An Introduction with Applications
6th Edition
ISBN: 9781119256830
Author: Amos Gilat
Publisher: John Wiley & Sons Inc
expand_more
expand_more
format_list_bulleted
Related questions
Question
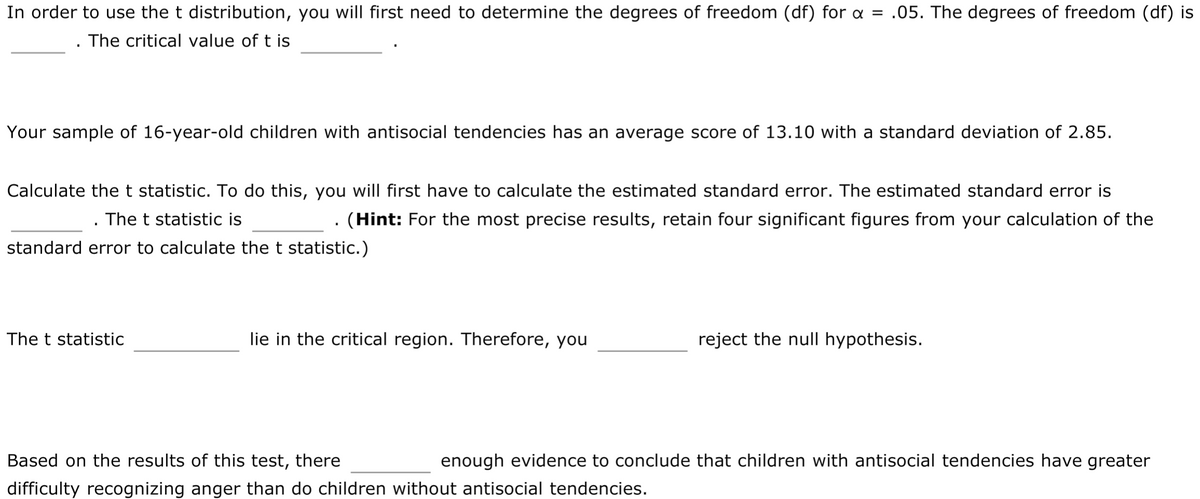

Transcribed Image Text:In order to use the t distribution, you will first need to determine the degrees of freedom (df) for α = .05. The degrees of freedom (df) is _____. The critical value of t is _______.
Your sample of 16-year-old children with antisocial tendencies has an average score of 13.10 with a standard deviation of 2.85.
Calculate the t statistic. To do this, you will first have to calculate the estimated standard error. The estimated standard error is _______. The t statistic is _______. (Hint: For the most precise results, retain four significant figures from your calculation of the standard error to calculate the t statistic.)
The t statistic ___________ lie in the critical region. Therefore, you _________ reject the null hypothesis.
Based on the results of this test, there ________ enough evidence to conclude that children with antisocial tendencies have greater difficulty recognizing anger than do children without antisocial tendencies.

Transcribed Image Text:Antisocial personality disorder (ASPD) is characterized by deceitfulness, reckless disregard for the well-being of others, a diminished capacity for remorse, superficial charm, thrill-seeking, and poor behavioral control. ASPD is not normally diagnosed in children or adolescents, but antisocial tendencies can sometimes be recognized in childhood or early adolescence. James Blair and his colleagues have studied the ability of children with antisocial tendencies to recognize facial expressions that depict sadness, happiness, anger, disgust, fear, and surprise. They have found that children with antisocial tendencies have selective impairments, with significantly more difficulty recognizing fearful and sad expressions.
Suppose you have a sample of 25 16-year-old children with antisocial tendencies and you are particularly interested in the emotion of anger. The average 16-year-old has a score on the emotion recognition scale of 12.50. (The higher the score on this scale, the more strongly an emotion has to be displayed to be correctly identified. Therefore, higher scores indicate greater difficulty recognizing the emotion). Assume that scores on the emotion recognition scale are normally distributed.
You believe that children with antisocial tendencies will have a harder time recognizing the emotion of anger (in other words, they will have higher scores on the emotion recognition test).
Expert Solution
This question has been solved!
Explore an expertly crafted, step-by-step solution for a thorough understanding of key concepts.

This is a popular solution

Trending nowThis is a popular solution!

Step by stepSolved in 2 steps with 1 images

Knowledge Booster


Learn more about
Need a deep-dive on the concept behind this application? Look no further. Learn more about this topic, statistics and related others by exploring similar questions and additional content below.Similar questions
- Find the z value such that 92% of the standard normal curve lies between −z and z. (Round your answer to two decimal places.)z =arrow_forwardUse the provided information to calculate the t statistic and critical t values.arrow_forwardAssume that a randomly selected subject is given a bone density test. Bone density test scores are normally distributed with a mean of 0 and a standard deviation of 1. Draw a graph and find P9, the 9th percentile. This is the bone density score separating the bottom 9% from the top 91%. Which graph represents P9? Choose the correct graph below.arrow_forward
- T-TEST FOR INDEPENDENT MEANS 1. Two types of instruments for measuring the amount of sulfur monoxide in the atmosphere are being compared in an air pollution experiment. It is desired to determine whether the types of instruments yield measurement having the same variability. The following readings were recorded for the instrument. Sulfur Monoxide Instrument A Instrument B 0.86 0.87 0.82 0.74 0.75 0.63 0.61 0.55 0.89 0.76 0.64 0.70 0.81 0.69 0.68 0.57 0.65 0.53 Assuming the population of measurements to be approximately normally distributed, test the null hypothesis using two tailed test at 0.05 level of significance.arrow_forwardThe time to complete an exam is approximately Normal with a mean of 50 minutes and a standard deviation of 8 minutes. The bell curve below represents the distribution for testing times. The scale on the horizontal axis is equal to the standard deviation. Fill in the indicated boxes. u = 50 o = 8 μ- 3σ μ20 μ-σ H-20 H+ 20 u+3ơarrow_forwardCalculate the correct t-statistics based on the information below. X1 = 200 X2 = 198 n1 = 17 n2 = 17 s1 = 2.45 s2 = 2.35 Let us assume that two groups of students at Tarleton are being compared on their average weights. Do you think the groups are different in terms of weight (measured in pounds)?arrow_forward
arrow_back_ios
arrow_forward_ios
Recommended textbooks for you
- MATLAB: An Introduction with ApplicationsStatisticsISBN:9781119256830Author:Amos GilatPublisher:John Wiley & Sons Inc
 Probability and Statistics for Engineering and th...StatisticsISBN:9781305251809Author:Jay L. DevorePublisher:Cengage Learning
 Statistics for The Behavioral Sciences (MindTap C...StatisticsISBN:9781305504912Author:Frederick J Gravetter, Larry B. WallnauPublisher:Cengage Learning
  Elementary Statistics: Picturing the World (7th E...StatisticsISBN:9780134683416Author:Ron Larson, Betsy FarberPublisher:PEARSON
 The Basic Practice of StatisticsStatisticsISBN:9781319042578Author:David S. Moore, William I. Notz, Michael A. FlignerPublisher:W. H. Freeman
 Introduction to the Practice of StatisticsStatisticsISBN:9781319013387Author:David S. Moore, George P. McCabe, Bruce A. CraigPublisher:W. H. Freeman
MATLAB: An Introduction with Applications
Statistics
ISBN:9781119256830
Author:Amos Gilat
Publisher:John Wiley & Sons Inc
Probability and Statistics for Engineering and th...
Statistics
ISBN:9781305251809
Author:Jay L. Devore
Publisher:Cengage Learning
Statistics for The Behavioral Sciences (MindTap C...
Statistics
ISBN:9781305504912
Author:Frederick J Gravetter, Larry B. Wallnau
Publisher:Cengage Learning
Elementary Statistics: Picturing the World (7th E...
Statistics
ISBN:9780134683416
Author:Ron Larson, Betsy Farber
Publisher:PEARSON
The Basic Practice of Statistics
Statistics
ISBN:9781319042578
Author:David S. Moore, William I. Notz, Michael A. Fligner
Publisher:W. H. Freeman
Introduction to the Practice of Statistics
Statistics
ISBN:9781319013387
Author:David S. Moore, George P. McCabe, Bruce A. Craig
Publisher:W. H. Freeman