Big Ideas Math A Bridge To Success Algebra 1: Student Edition 2015
1st Edition
ISBN: 9781680331141
Author: HOUGHTON MIFFLIN HARCOURT
Publisher: Houghton Mifflin Harcourt
expand_more
expand_more
format_list_bulleted
Question

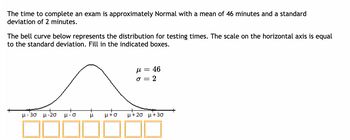
Transcribed Image Text:The time to complete an exam is approximately Normal with a mean of 46 minutes and a standard deviation of 2 minutes.
The bell curve below represents the distribution for testing times. The scale on the horizontal axis is equal to the standard deviation. Fill in the indicated boxes.
The bell curve is a standard normal distribution, characterized by the highest frequency near the mean, tapering off as it moves away from the mean. The mean (\( \mu \)) is 46 minutes, and the standard deviation (\( \sigma \)) is 2 minutes.
The x-axis is marked as follows:
- \( \mu - 3\sigma \)
- \( \mu - 2\sigma \)
- \( \mu - \sigma \)
- \( \mu \)
- \( \mu + \sigma \)
- \( \mu + 2\sigma \)
- \( \mu + 3\sigma \)
These markings translate into the following values:
- \( \mu - 3\sigma = 40 \)
- \( \mu - 2\sigma = 42 \)
- \( \mu - \sigma = 44 \)
- \( \mu = 46 \)
- \( \mu + \sigma = 48 \)
- \( \mu + 2\sigma = 50 \)
- \( \mu + 3\sigma = 52 \)
Fill in these values in the indicated boxes under the bell curve.
Expert Solution
This question has been solved!
Explore an expertly crafted, step-by-step solution for a thorough understanding of key concepts.
Step by stepSolved in 2 steps with 1 images

Knowledge Booster
Similar questions
Recommended textbooks for you
 Big Ideas Math A Bridge To Success Algebra 1: Stu...AlgebraISBN:9781680331141Author:HOUGHTON MIFFLIN HARCOURTPublisher:Houghton Mifflin Harcourt
 Holt Mcdougal Larson Pre-algebra: Student Edition...AlgebraISBN:9780547587776Author:HOLT MCDOUGALPublisher:HOLT MCDOUGAL
 Glencoe Algebra 1, Student Edition, 9780079039897...AlgebraISBN:9780079039897Author:CarterPublisher:McGraw Hill
 College Algebra (MindTap Course List)AlgebraISBN:9781305652231Author:R. David Gustafson, Jeff HughesPublisher:Cengage Learning

Big Ideas Math A Bridge To Success Algebra 1: Stu...
Algebra
ISBN:9781680331141
Author:HOUGHTON MIFFLIN HARCOURT
Publisher:Houghton Mifflin Harcourt

Holt Mcdougal Larson Pre-algebra: Student Edition...
Algebra
ISBN:9780547587776
Author:HOLT MCDOUGAL
Publisher:HOLT MCDOUGAL

Glencoe Algebra 1, Student Edition, 9780079039897...
Algebra
ISBN:9780079039897
Author:Carter
Publisher:McGraw Hill

College Algebra (MindTap Course List)
Algebra
ISBN:9781305652231
Author:R. David Gustafson, Jeff Hughes
Publisher:Cengage Learning